Custom Map Vector: Turn Any Country Into a Dot Map
Need a custom map vector that fits your brand or data story—without hours of manual editing? With a modern dot map style, you can turn any country into a clean, scalable visual that works for posters, dashboards, and presentations alike. In this guide, you’ll learn how dot maps work, when to use them, and how to generate editable SVGs instantly with World in Dots.
What Is a Custom Map Vector?
A custom map vector is a map you can fully edit—change colors, shapes, and density—because it’s made from vector paths (not pixels). Exported as SVG, AI, or PDF, it scales from social tiles to wall posters with no loss of quality.
Why dot maps?
- Minimalist aesthetic that looks polished in any layout
- Readable at multiple scales (great for web and print)
- Flexible styling (density, spacing, and color are all adjustable)
- Lightweight SVG ideal for performance and interactivity
When to Use a Dot Map (By Country)
- Design & Branding: Country-specific hero graphics, pitch decks, event backdrops
- Education: Clean geographic outlines for handouts and wall charts
- Data Viz: Density variations to hint at population or activity centers
- Decor: Poster-ready artwork for offices, cafes, and homes
- Product UI: Country pickers or onboarding screens with a modern look
How to Turn Any Country Into a Dot Map (Fast)
With World in Dots, you can generate a country map as a dotted SVG in a few clicks:
Step 1 — Select the Country
Choose any country (or region/continent) from the menu.
Step 2 — Pick Dot Style
Choose uniform dots for minimalism or denser grids for detail.
Step 3 — Customize
- Dot size & spacing to control visual weight
- Colors to match your brand or theme
- Margins & crop for poster or slide layouts
Step 4 — Export as SVG
Download an editable SVG for Figma/Illustrator—or drop it straight into your codebase.
Styling Tips for Better Dot Maps
- Go denser for posters, lighter for dashboards
- Use one accent color (e.g., highlight a region/province)
- Mind contrast: dark dots on light backgrounds or vice versa
- Add breathing room: increase outer padding for a gallery look
- Keep labels minimal: let the dot pattern carry the form
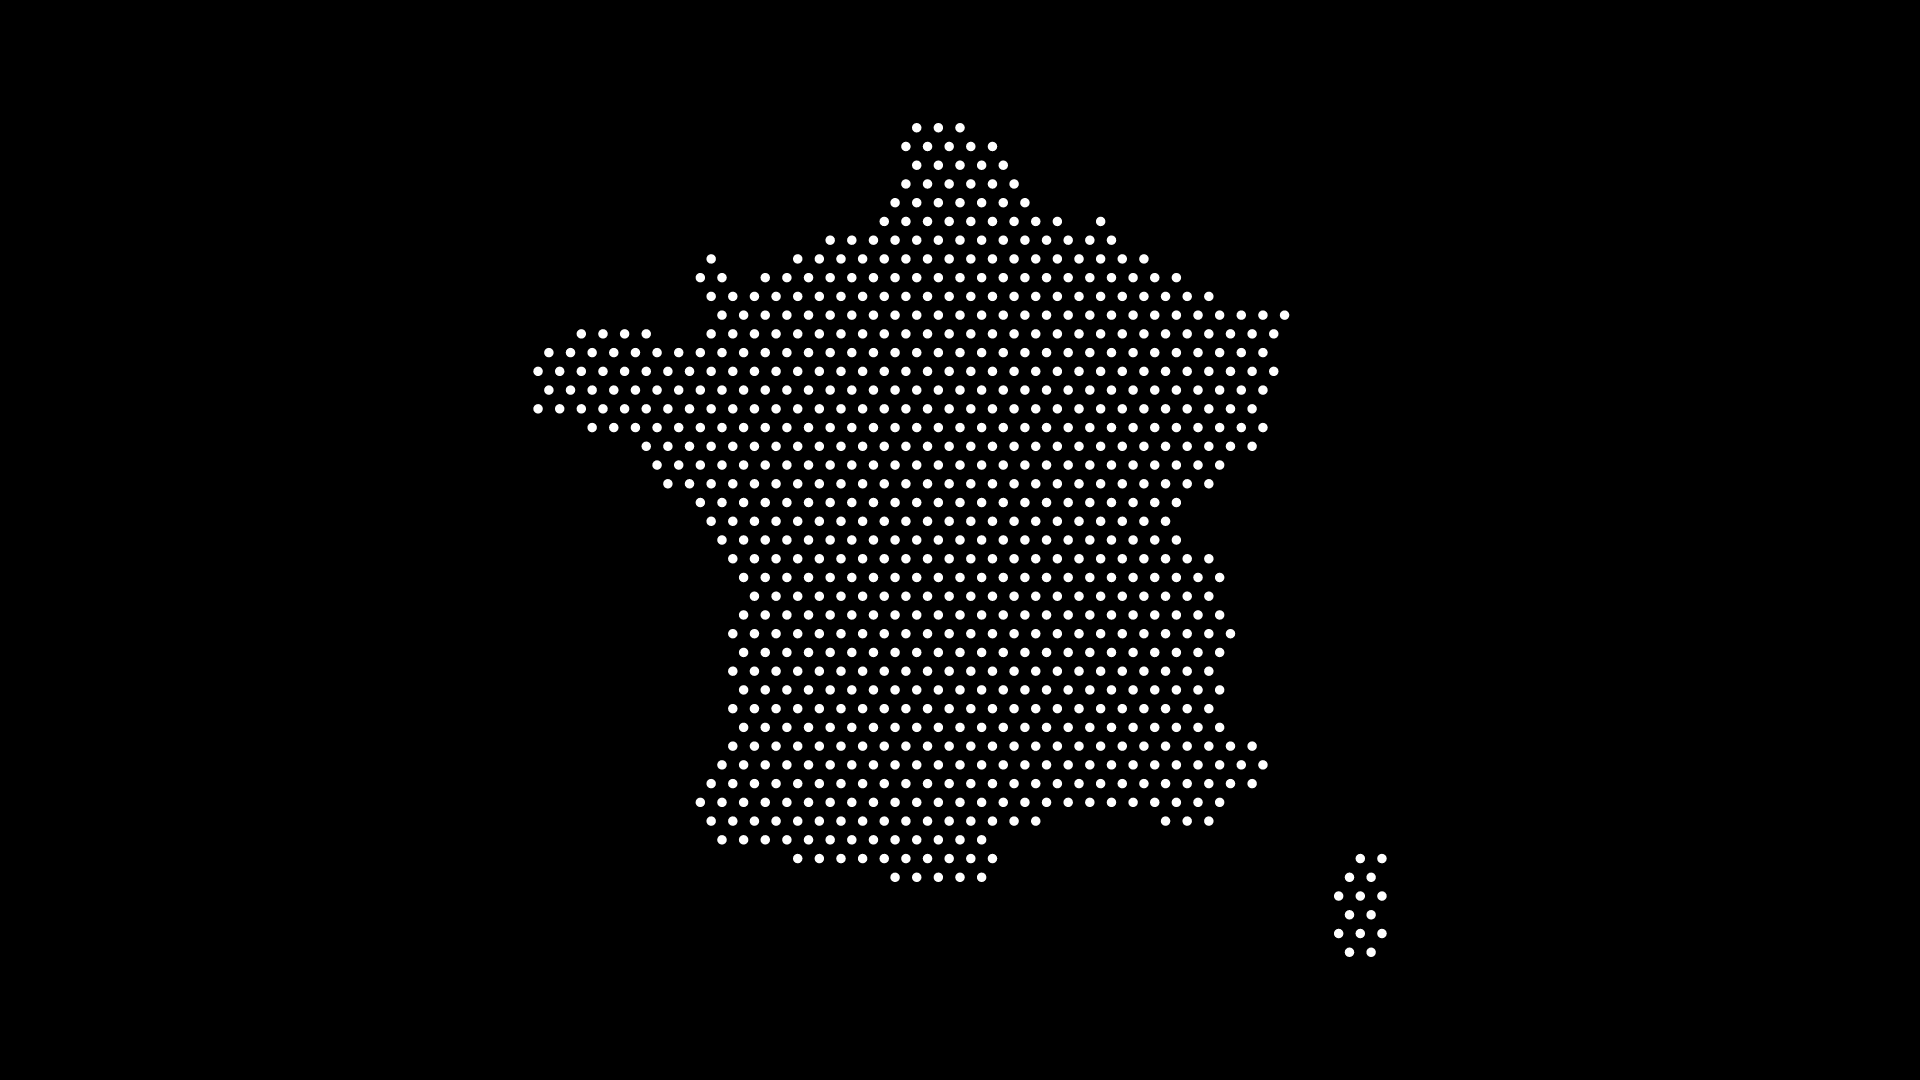
Example: Country Dot Map (SVG)
This example shows a country rendered in evenly spaced dots—clean, scalable, and ready for print or web.
Export & Workflow
- SVG: Best for web, dashboards, and design tools (Figma, Illustrator)
- PDF/AI: Print workflows, prepress reviews
- PNG: Social previews or quick mockups (export from your vector file)
Frequently Asked Questions
Can I highlight multiple regions within a country?
Yes—export as SVG, then group and color regions independently in your editor.
Will the edges look accurate with dots?
Dot maps approximate outlines. Increase density for more fidelity, or combine dots with a thin stroke outline.
Can I animate the dots on the web?
Yes—SVG groups can be targeted with CSS or JS for hover/entrance animations.
Final Thoughts
A custom map vector in a dot style gives you the sweet spot between clarity and character. Whether you’re publishing a report, building an app, or designing a poster, a dotted country map feels modern, readable, and brandable.
With World in Dots, you can turn any country into a dot map—and export an editable SVG—in seconds.
Try it now and ship a map that looks as good as your idea.