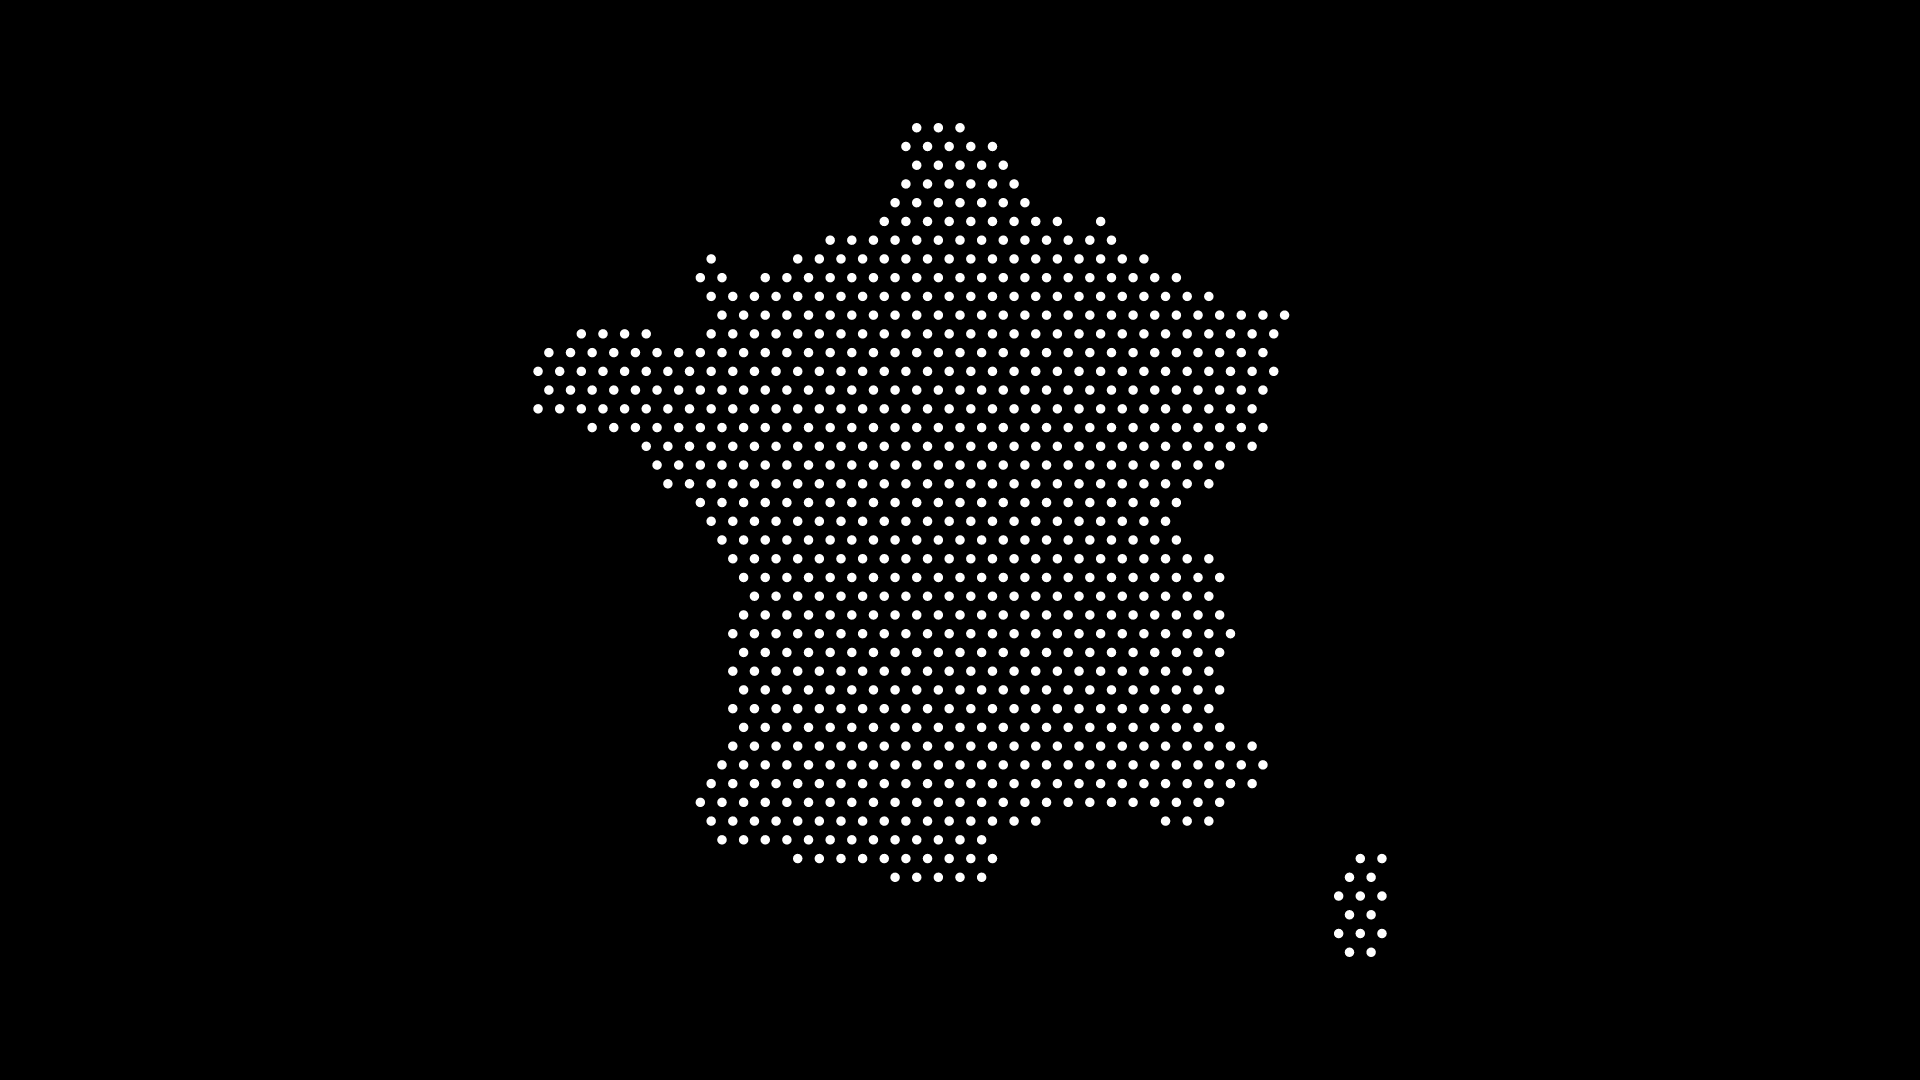
Dot Map: What It Is and How to Create One Online

A dot map is one of the most effective ways to show patterns, distributions, and geographic data using simple visual elements: dots. From population density to rainfall patterns, dot maps transform raw data into visuals that are both engaging and easy to understand.
But dot maps aren’t just for geographers and data scientists — they’re also popular with designers, educators, and creatives who want a minimalist way to represent locations and regions. In this article, we’ll explore what dot maps are, why they’re useful, and how you can create your own online in seconds.
What is a Dot Map?
A dot map is a type of map that uses dots to represent a feature or value. Each dot may represent one item (like a city) or a quantity of items (like 10,000 people).
There are two main types:
- One-to-One Dot Maps: Each dot represents a single event, person, or object.
- One-to-Many Dot Maps: Each dot represents a set number of items (e.g., 1 dot = 1,000 people).
Beyond data, stylized dot maps also exist, where dots form patterns that trace country borders or continents for artistic or minimalist purposes.
Why Dot Maps Are Useful
Dot maps combine simplicity with visual impact. Here’s why they’re so popular:
- Easy to Understand — Dots instantly convey density and distribution.
- Visually Appealing — Clean, modern, and engaging for both print and digital.
- Flexible — Works for population, climate, migration, education, and even art.
- Scalable — Dot maps can be as detailed or abstract as your project needs.
How to Create a Dot Map Online
In the past, dot maps required GIS software and complex datasets. Now, with tools like World in Dots, you can generate a dot map in seconds.
Step 1: Select Your Region
Choose the world, a continent, or a specific country.
Step 2: Adjust the Style
Pick a dotted layout that matches your project’s aesthetic — minimalist, dense, or pixel-style.
Step 3: Customize the Look
- Change dot size and spacing
- Apply colors for branding or emphasis
- Highlight specific areas if needed
Step 4: Export Your Map
Download as SVG (perfect for editing and web use) or as a high-resolution file for posters and print.
Example: Dot Map of the World

This dotted world map was generated instantly and is ideal for:
- Infographics and dashboards
- Educational materials
- Minimalist poster designs
- Landing pages and presentations
Practical Uses of Dot Maps
Dot maps appear across many fields:
- Design & Branding: Backgrounds, posters, and logos.
- Education: Teaching geography, demographics, and environmental issues.
- Data Visualization: Showing population, climate, migration, or resources.
- Decor & Art: Minimalist dot maps for modern wall art.
Final Thoughts
A dot map is more than just a way to show data — it’s a timeless design style that bridges art and information. Whether you’re a designer, educator, or analyst, dot maps offer clarity and beauty in equal measure.
With platforms like World in Dots, you can now create custom dot maps online in seconds, tailored to your project’s style and purpose.
Ready to make your own dot map? Try World in Dots today.