GeoJSON to SVG: How to Convert Map Data for Web Design
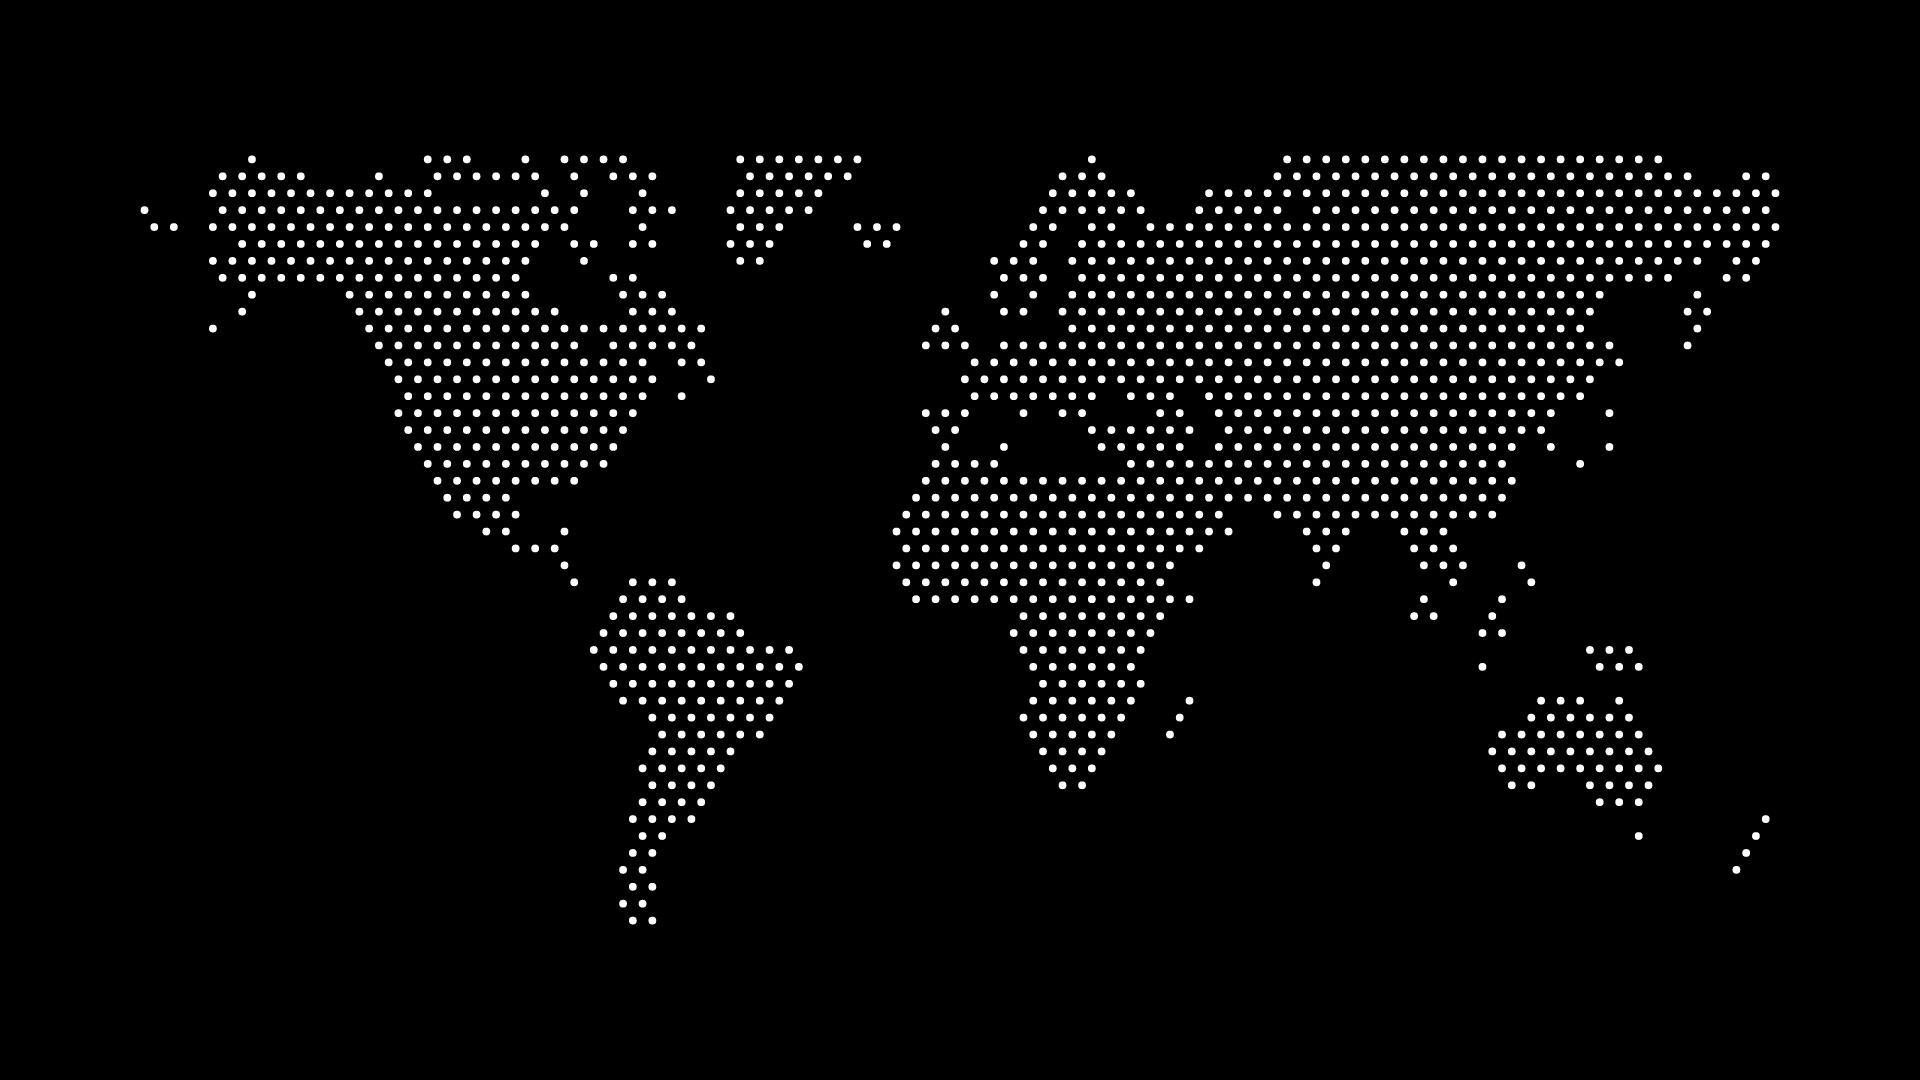
Converting GeoJSON to SVG turns raw geographic coordinates into paths a browser or design tool already knows how to render. GeoJSON is built for data — coordinate arrays nested inside features, properties, and geometry types — while SVG is built for display, so the moment a map needs to be styled, animated, or dropped into a page, it needs to make that jump.
Why the conversion matters
A GeoJSON file on its own does nothing visually. It has to be handed to a mapping library, a script, or a rendering engine before a single shape appears. An SVG, by contrast, is already a picture: open it in a browser and the country outline is there, with no JavaScript required to draw it.
That difference shows up the moment a map has to leave a mapping context. A designer pasting a border into Figma, a developer inlining a shape into a landing page, or anyone who wants to fill a country with a solid color using plain CSS all need the geometry expressed as <path> elements, not as longitude and latitude pairs in a JSON array.
What the conversion actually does
At its core, converting GeoJSON to SVG means projecting geographic coordinates onto a flat 2D plane and writing the result as path data:
- Read the geometry. A
PolygonorMultiPolygonfeature holds one or more rings of[longitude, latitude]points. - Project the coordinates. Longitude and latitude are not pixels — they need a projection (even a simple equirectangular one) to map onto an SVG
viewBox. - Flip the Y axis. Latitude increases going north, but SVG's Y axis increases going down. Skipping this step is the most common reason a converted map renders upside down.
- Build the path string. Each ring becomes an
M/L/Zpath command sequence, and multiple polygons become multiple subpaths within one<path>. - Set the
viewBoxand stroke/fill. Once the path exists, standard SVG attributes control appearance.
Doing this by hand in a script is reasonable for a one-off country, but tedious for a full dataset — every feature needs the same projection and flip logic applied consistently, and small country-specific bugs (a reversed ring, an off-by-one on the bounding box) are easy to miss until the shape renders wrong.
Choosing between a script and a tool
Writing your own conversion makes sense when the output needs to be part of a build pipeline — for example, generating SVGs from a live dataset on every deploy. A small script using a projection library can loop over a FeatureCollection and emit one <path> per feature.
For a one-off need — pulling a country or region out of a GeoJSON file to use as a static asset — a browser-based converter is faster and removes the risk of a subtle projection bug. World in Dots' GeoJSON to SVG converter does exactly this: paste or upload a Feature, FeatureCollection, or bare geometry, and it returns styled, ready-to-use SVG markup you can copy directly into a page or design file.
Common problems and how to spot them
- Inverted shapes. If a country renders as its own negative space (everything filled except the landmass), a hole ring was probably treated as an outer ring, or vice versa.
- Distorted proportions. A naive equirectangular projection stretches countries near the poles. For most design purposes this is an acceptable trade-off, but it's worth checking against a reference shape before shipping.
- Path data that's too large. A high-resolution coastline can produce a path string with tens of thousands of points, which slows down rendering and bloats file size. Simplifying the source GeoJSON before conversion — reducing vertex count with a tool like GeoJSON Simplifier — fixes this without visibly changing the shape.
- Missing
viewBox. Without one, the SVG won't scale correctly inside a responsive container.
Where the SVG goes next
Once a shape exists as SVG, it behaves like any other vector graphic. It can be:
- Colored and outlined with CSS, including on hover or by data value.
- Inlined directly into HTML so search engines and screen readers can access its markup, as covered in Inline SVG vs img Tag: How to Embed a Dotted Map.
- Exported as PNG for platforms that don't accept vector formats — see SVG vs PNG Maps: Choosing the Right Format for when each makes sense.
- Compressed for faster page loads, following the same principles in How to Compress SVG Maps for Faster Loading.
An alternative starting point
If the end goal is a clean map graphic rather than a precise data conversion, it's worth asking whether GeoJSON is even the right starting material. World in Dots skips the projection-and-path-building step entirely by generating a dotted vector map for any country, region, or US state directly — no GeoJSON, no coordinate math, just density, color, and dot-shape controls with an SVG or PNG on the other end. That's the faster route when the map is going into a design rather than a data pipeline, as described in Dotted Map SVG: A Complete Guide for Designers.
Final thoughts
Converting GeoJSON to SVG is a small but exacting piece of geometry work: project the coordinates, flip the axis, build the path, and watch for inverted rings or oversized files. A script earns its keep in a repeatable pipeline; a browser tool is the quicker path for a single map. Either way, the SVG that comes out the other end is the format that actually renders on a web page, in a design file, or on a printed sheet.