How to Create an Open Graph Image with a Dotted World Map
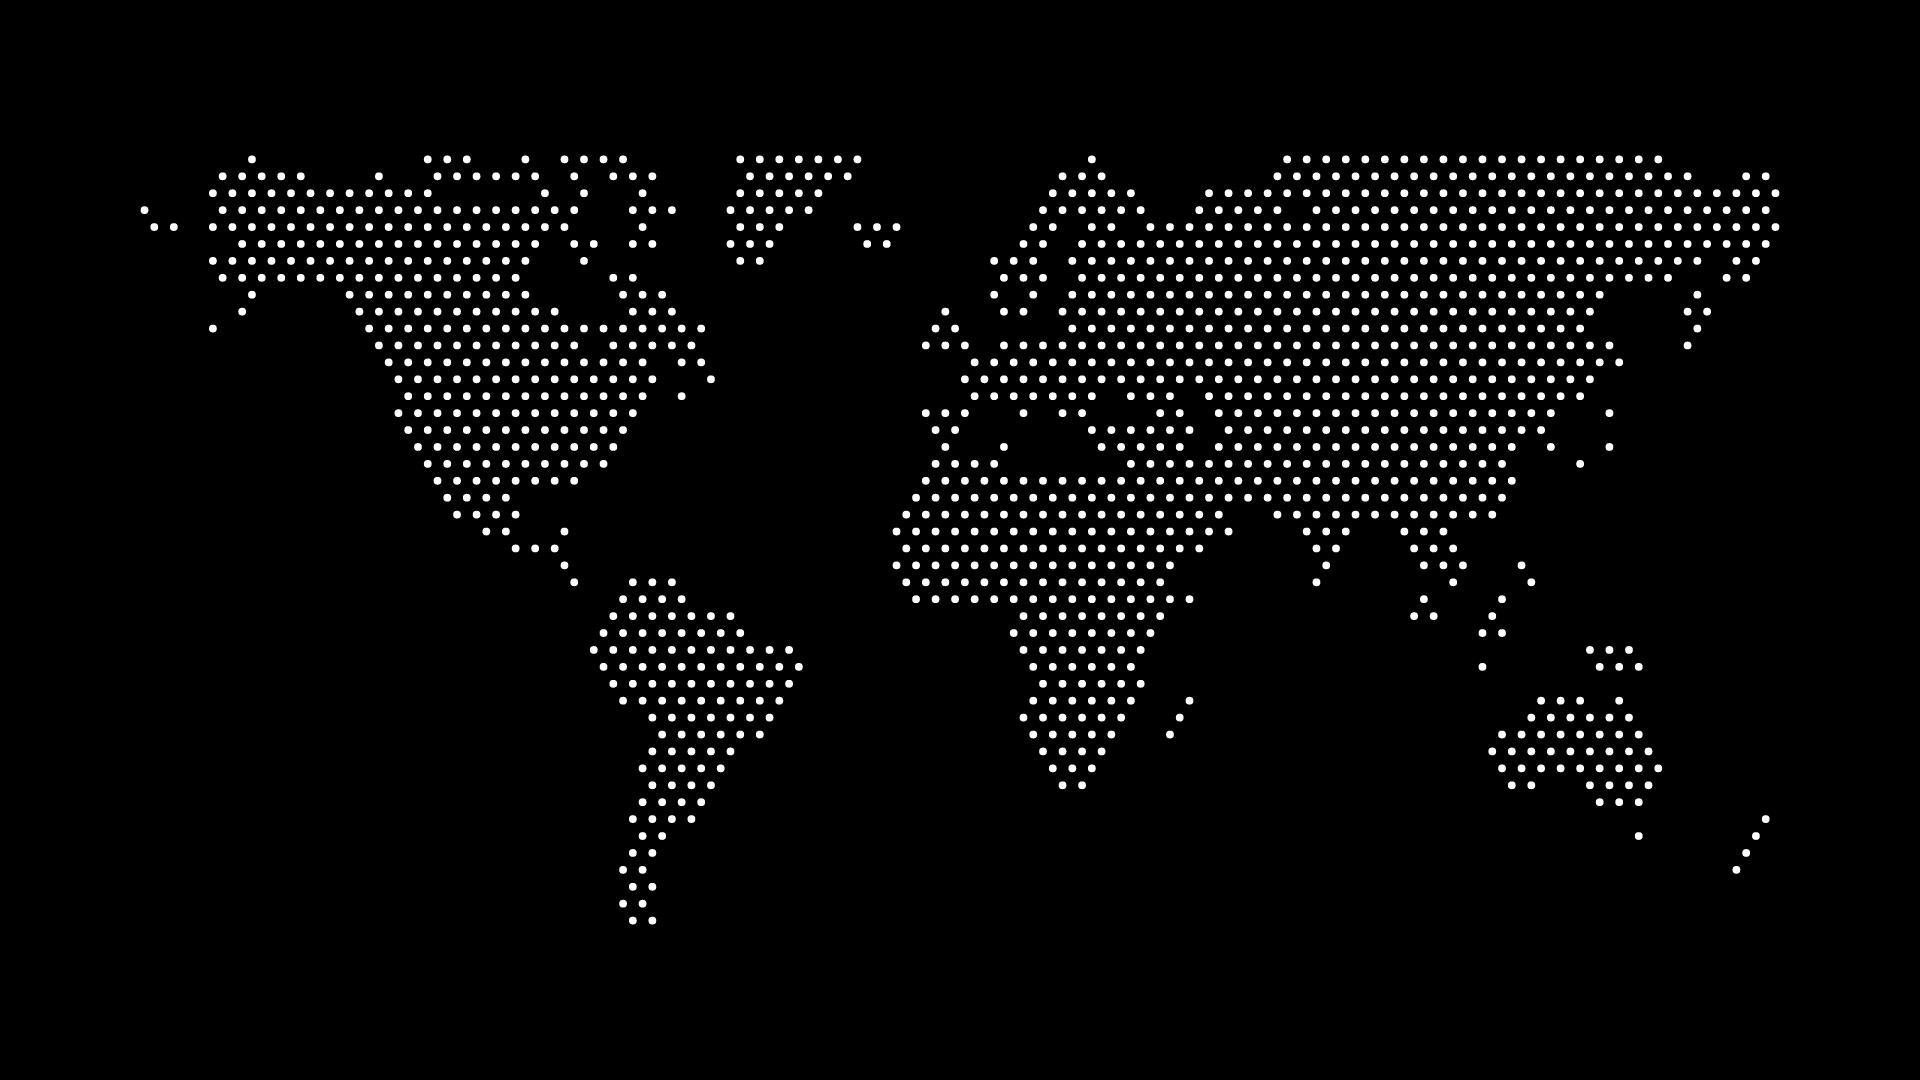
An Open Graph image with a dotted world map is a natural fit for any brand whose story is inherently global — remote-first companies, travel products, logistics platforms, or content about international topics. The og:image tag controls the preview card that shows up when a link is shared on Slack, LinkedIn, Twitter/X, or in a text message, and a distinctive map reads better in that small preview than a generic stock photo or a plain logo on a solid background.
Here's how to put one together correctly, since the format has a few hard technical requirements that a Photoshop composite or Figma frame won't automatically satisfy.
Get the dimensions right first
Most platforms render Open Graph previews at or around 1200 × 630 pixels, an aspect ratio of roughly 1.91:1. Getting this wrong is the most common mistake:
- Too tall or too square and platforms will crop the sides, often cutting off exactly the part of the map you designed around.
- Too small and the image can look soft or pixelated once a platform scales it up for a larger preview card.
Build the canvas at 1200×630 (or a clean multiple like 2400×1260 for a sharper result) from the start, rather than designing at a different ratio and cropping afterward.
Where the map should sit in the frame
A full-bleed world map behind a headline is the most common layout, but it only works if there's enough contrast left for text. A few layout patterns that hold up well at preview size:
- Map as a full-bleed background, text on a solid or semi-transparent panel — keeps the headline legible regardless of how busy the map underneath is.
- Map confined to one side of the frame, text on the other — avoids any contrast fight entirely, and reads clearly even at the small thumbnail size some platforms use.
- Map as a subtle, low-opacity texture behind a centered logo and tagline — works well when the map is meant to reinforce a "global" feel rather than be the main visual.
Whichever layout you choose, preview it small — most people will see this image at roughly the size of a business card inside a chat app, not full screen. Text and dot detail that reads fine at full size can disappear at preview scale.
Export as PNG, not SVG
Open Graph images must be a raster format (PNG or JPEG) — social platforms and messaging apps do not render SVG for link previews. Generate your dotted map, then export it as a PNG at the target resolution rather than linking to the SVG directly. If you need the crispest possible result on high-density displays, export at 2x (2400×1260) and let the platform downscale it; going the other direction and upscaling a small PNG will look soft.
For more on the two formats generally, see Dotted Map PNG vs SVG: Which Format Should You Use?.
Keep the file size reasonable
Some platforms silently fail to fetch or cache an og:image that's too large, and even when they don't, a bloated image slows down whatever page or crawler is generating the preview. Flatten the design before exporting, avoid layering in unnecessary gradients or noise textures, and compress the final PNG. The same compression principles used for web-embedded maps apply directly here — see How to Compress SVG Maps for Faster Loading for the underlying approach, even though the final Open Graph asset itself is a raster PNG rather than an SVG.
Testing before you ship it
Once the image is live at its URL, check how it actually renders using each platform's own debugging tool (LinkedIn's Post Inspector, Twitter/X's Card Validator, or simply pasting the link into a private Slack channel). Caching is aggressive on some platforms, so if you update the image later, you may need to force a re-crawl rather than assuming the new version will show up immediately.
Final thoughts
A dotted world map makes a distinctive Open Graph image for any brand with a genuinely global story, as long as you respect the format's hard constraints: build at 1200×630, export as PNG, keep enough contrast for text, and preview at thumbnail size before publishing.
Generate a wide-format map at World in Dots and export it as PNG to use as your site's og:image.