How to Use a Dotted Map in an Annual Report
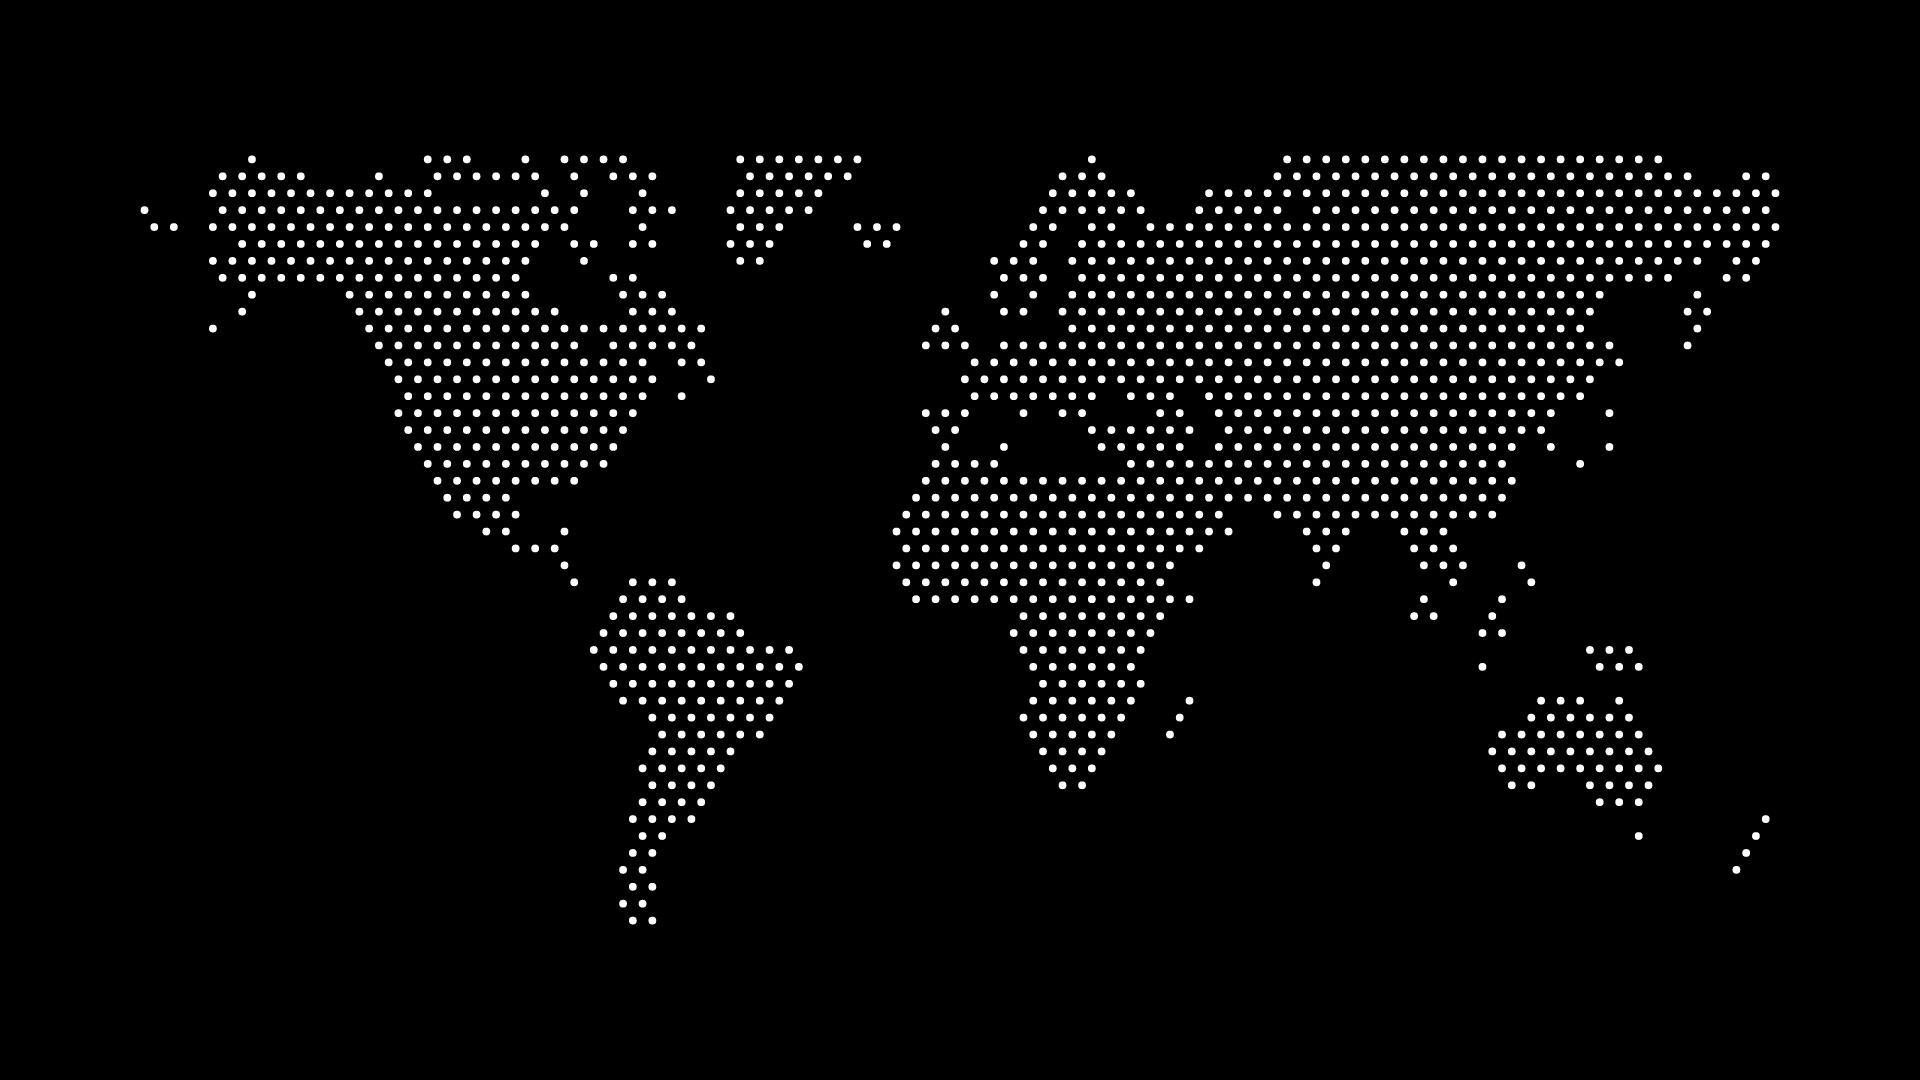
A dotted map can give an annual report a refined geographic cue, whether the report discusses markets served, international operations, a distributed team, or a year of expansion. The map should support accurate reporting—not turn a formal document into a decorative brochure.
Use the map where geography matters
Add a map near a section that discusses a specific geographic topic. A world map can introduce international operations; a country or regional map can support a more focused market update. If geography is not part of the content, leave the map out.
Pair it with clear evidence
An annual report needs the map’s visual shorthand to be explained by the surrounding text, data, or captions. Pair the graphic with a short statement, a measured statistic, or a brief list of regions. Do not let a decorative world map imply details that are not present in the report.
Choose a publication-ready style
Use restrained colors that fit the report palette, avoid overly dense patterns, and allow generous margins. The map should reproduce clearly in both a digital PDF and a printed page. SVG is useful when the map may need to be resized across layouts; a high-resolution PNG is useful for fixed image workflows.
Keep captions and text readable
Never place fine report text directly over a dense map. Give headings, charts, labels, and captions their own clear space. If the map is used as a background, make it quieter than the actual reporting content.
Final thoughts
Use a dotted map in an annual report as a visual bridge between a geographic story and the evidence that supports it. A simple, well-placed map can add polish while letting the report’s data remain the authority.