How to Use a Dotted Map in Gamma Presentations
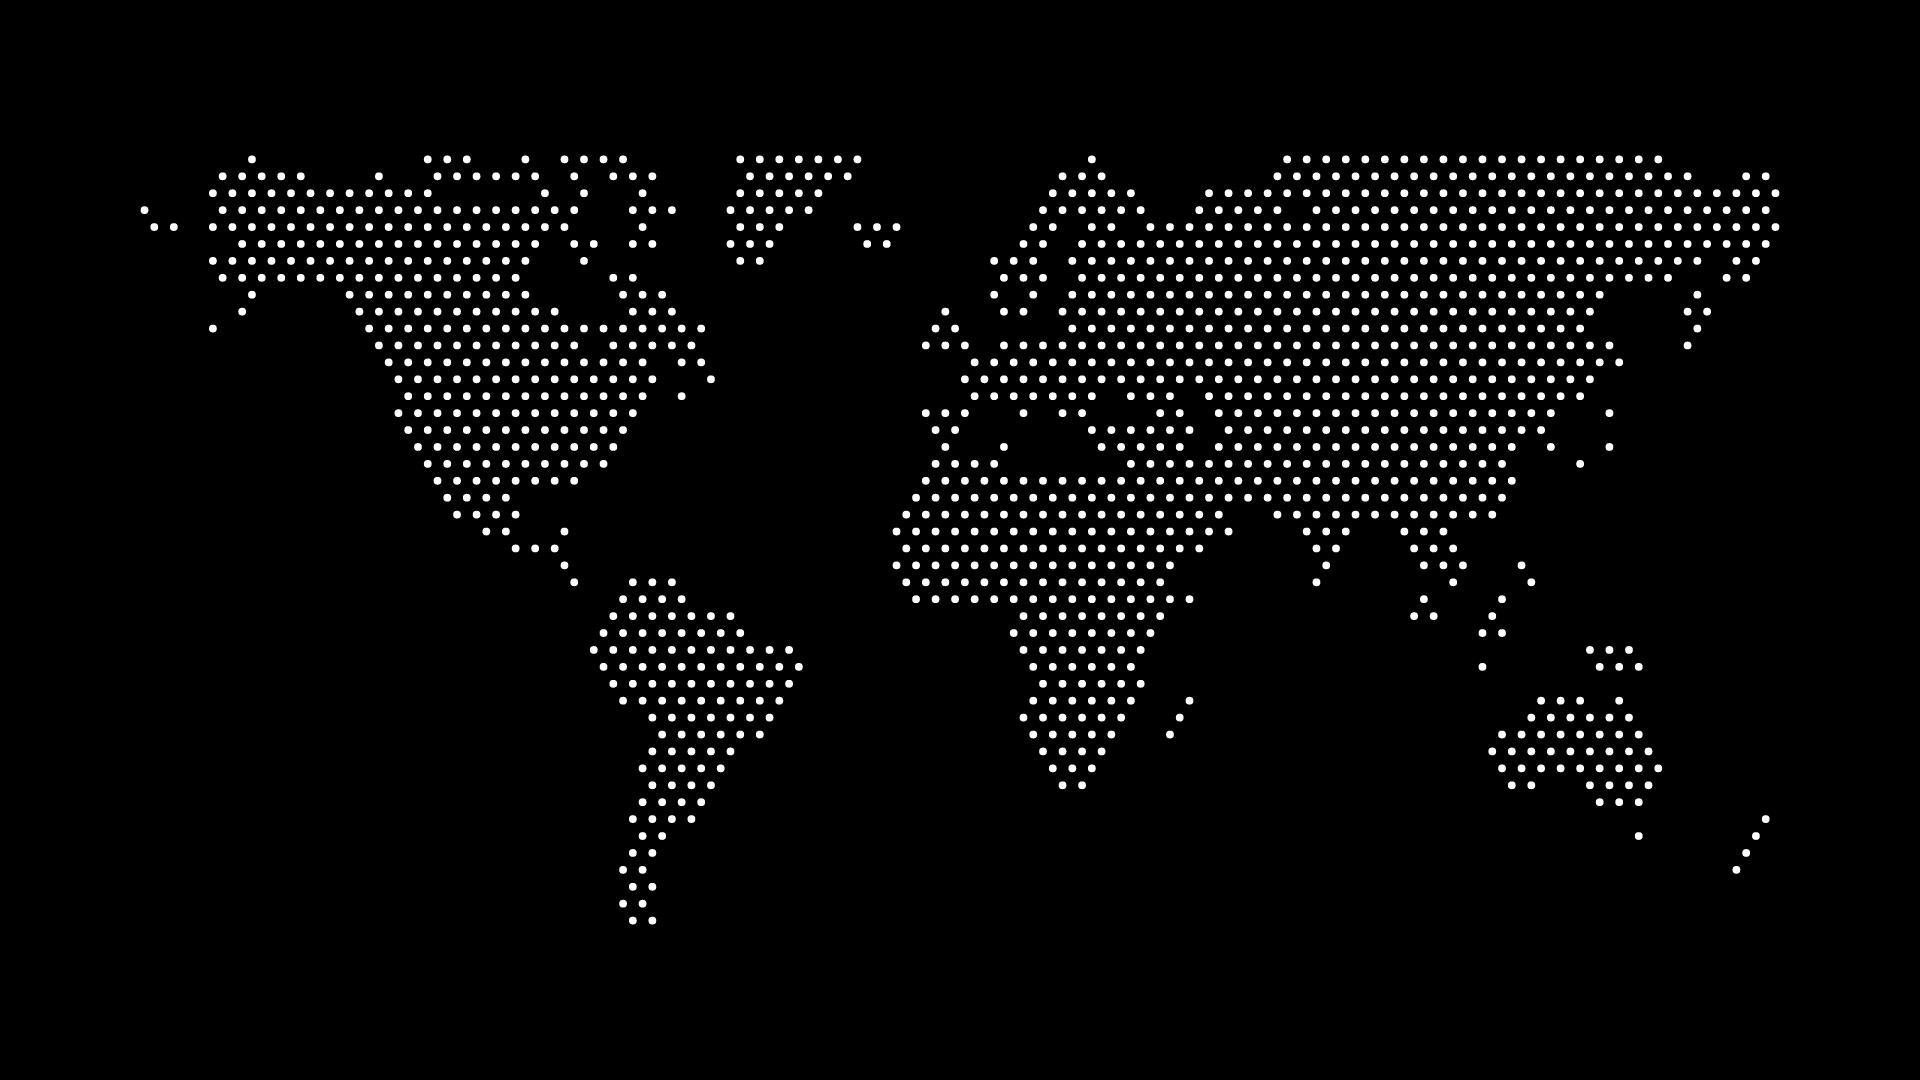
A dotted map in a Gamma presentation can provide a quiet, modern visual for a global story, company overview, market section, or team slide. As with any presentation graphic, the map should make the point easier to understand—not make the slide more decorative than useful.
Create the map around the card or slide
Choose the world, region, or country that fits the story. Then set dot color, density, padding, and background for the size where the map will appear. Smaller cards need simpler patterns; wide visual sections can support more detail.
Keep hierarchy intact
Place the map beside the main statement, behind a short statistic, or cropped from an edge. Keep the title, key number, and CTA in a clear reading area. Avoid layering dense dots behind text-heavy content.
Use a muted color for a supporting visual. If the map needs to be more prominent, give it its own space instead of increasing its contrast across the whole slide.
Choose a practical format
SVG is useful when you need a scalable master asset. A high-resolution PNG is useful for a fixed image placement. Keep both versions when the presentation may be moved between tools or exported in different formats.
Check the final presentation view
Preview the map at the actual card or slide size. Make sure dots remain visible, the crop looks intentional, and the map does not distract from the presentation’s core message.
Final thoughts
Dotted maps can help Gamma presentations feel more visual and coherent when geography matters. Set the map up for the final layout, keep the hierarchy simple, and use it to support—not replace—the story.