How to Use a World Map Graphic in a Case Study
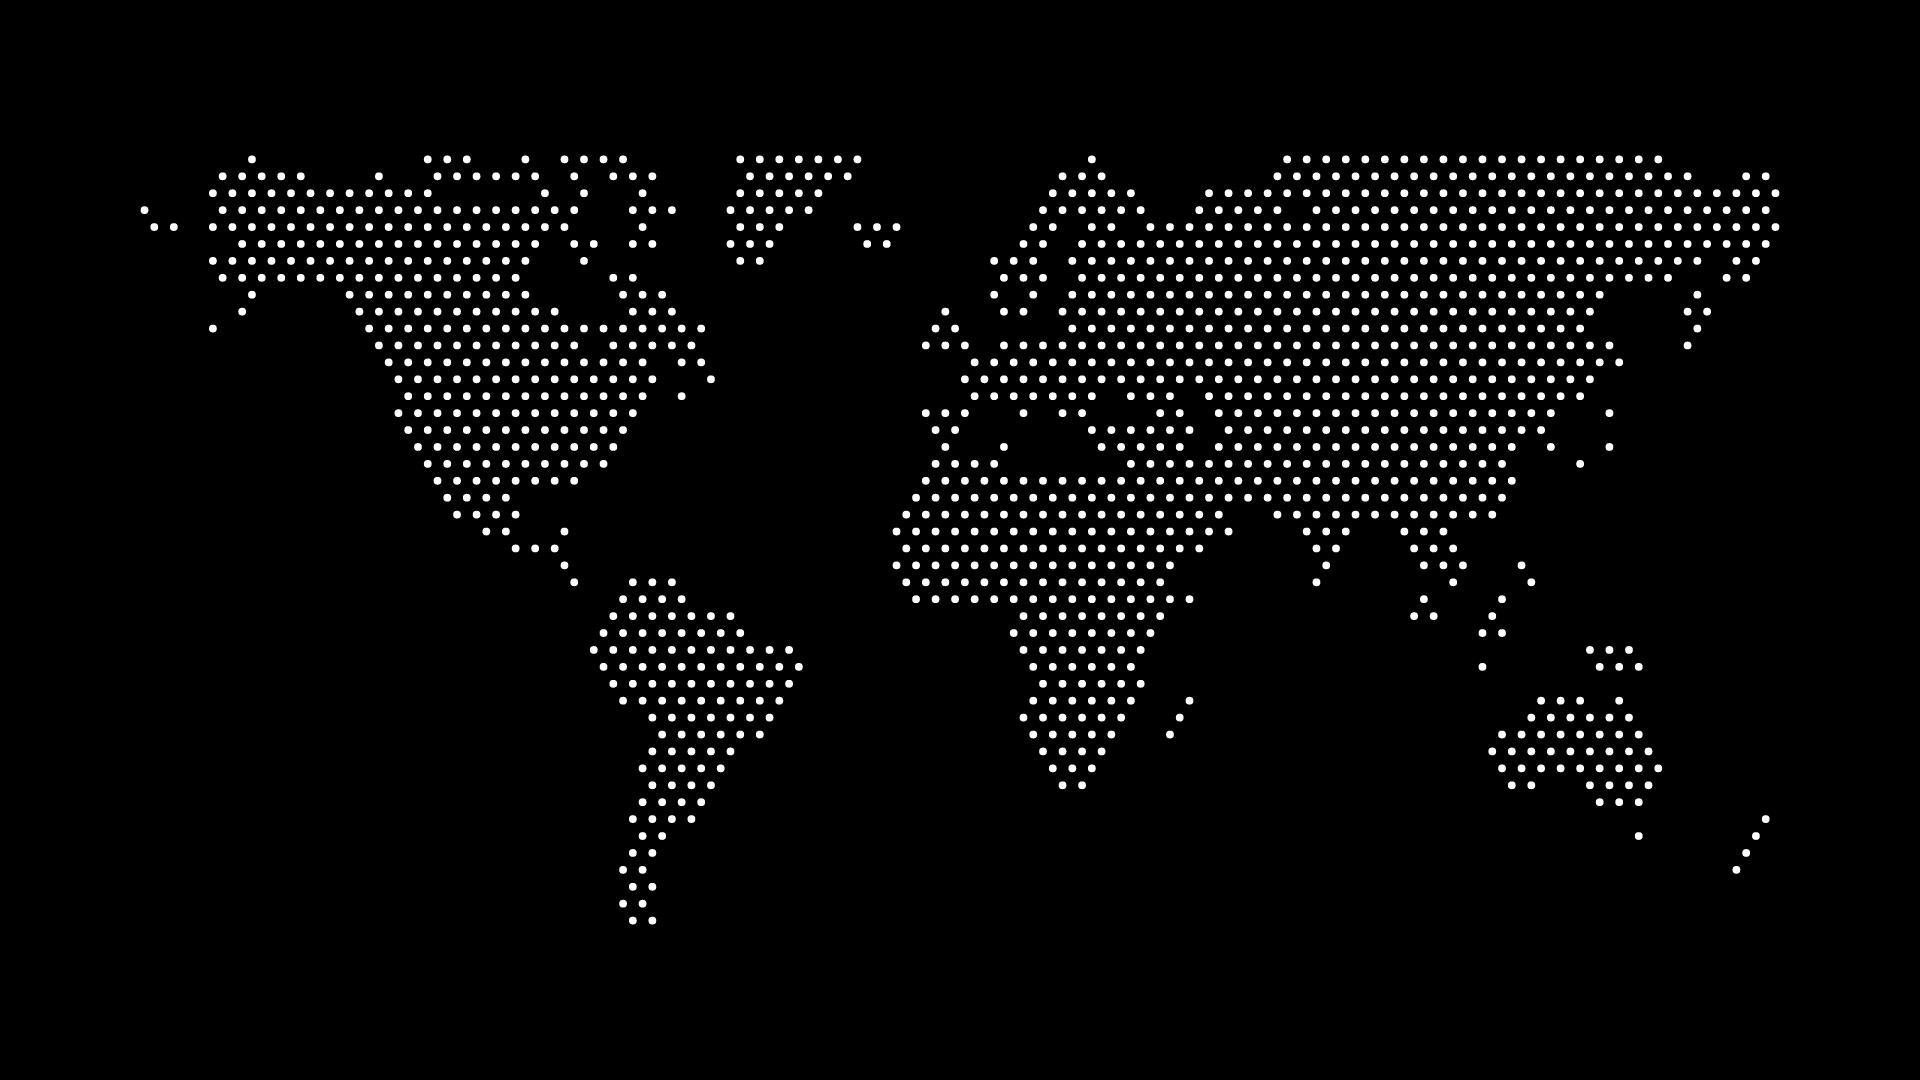
A world map graphic can help a case study establish context quickly when the project involves multiple regions, international customers, or a specific geographic expansion. It should support the story—not become a vague visual claim about scale.
Identify the geographic insight
Ask what geography adds to the case study. It might show that a customer operates across markets, that a rollout crossed time zones, or that the project focused on a specific region. If the answer is unclear, the map probably does not belong on the page.
Put the map near the relevant evidence
Use the graphic in the introduction, alongside a customer overview, or beside the portion of the case study that discusses regional context. Pair it with a clear caption, supporting metric, or short explanation. Readers should not need to guess what the map is meant to represent.
Match the map scope to the story
A full world map is useful for a genuinely international story. A regional or country map is better for a focused engagement. Choosing the narrowest relevant scope makes the visual more specific and keeps the page from feeling generic.
Keep the customer story first
Do not use a dense map behind quotations, results, or product screenshots. Give the graphic a dedicated area or make it a subtle background in a quiet layout section. The visual hierarchy should lead readers to the challenge, solution, and outcome before they notice the decoration.
Final thoughts
Use a world map graphic when it makes a case study’s geography clearer. Keep it accurate, pair it with evidence, and let the customer outcome remain the reason the reader remembers the story.