How to Use World Map SVGs in Keynote Presentations
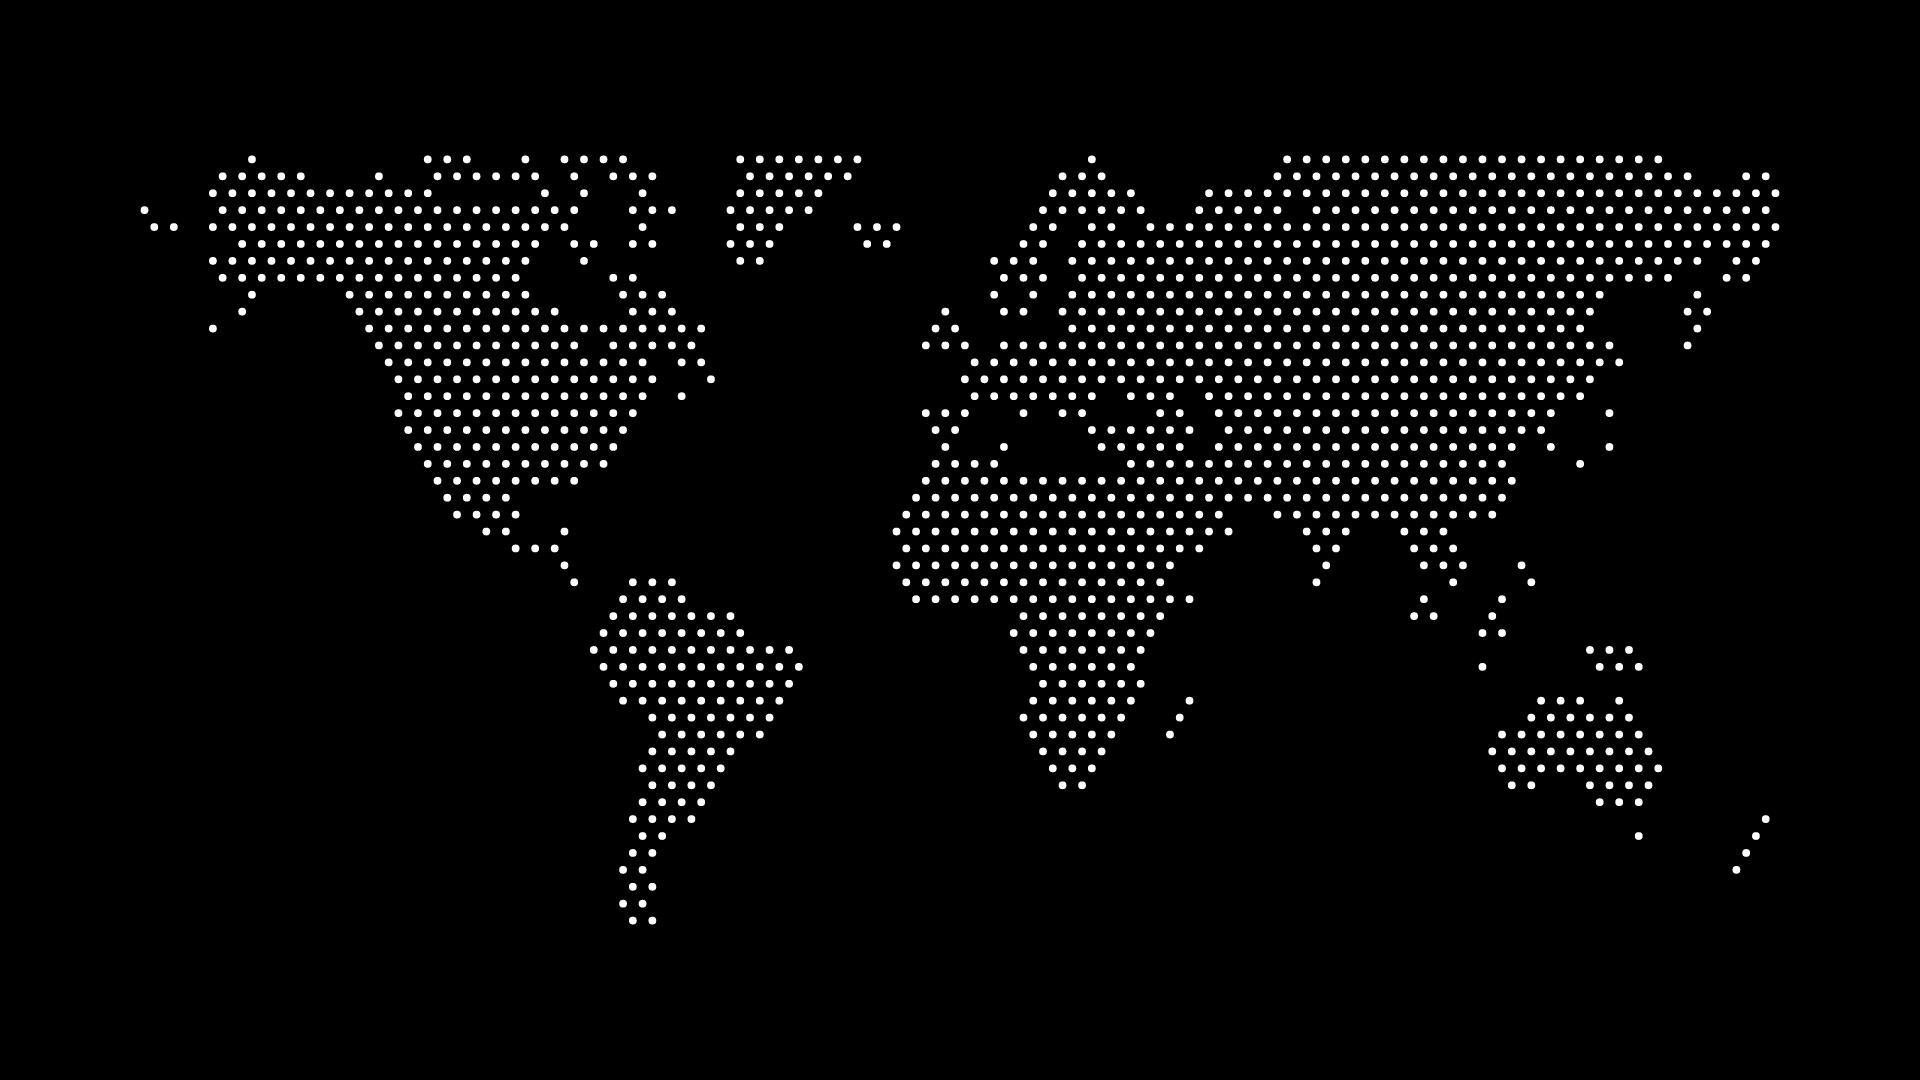
A world map SVG can give a Keynote presentation a crisp map graphic that remains sharp as a slide is resized. It is useful for title slides, market context, company reach, and section transitions where the map is supporting the presentation’s message.
Prepare the map before importing
Create the map at a shape and style that suits the slide. Choose the world or region, set the dot color and background, and adjust density for the scale at which the map will appear. A dense map that looks refined in a design editor can look busy on a projected slide.
Import and place the SVG
Add the SVG to a Keynote slide using the normal media or drag-and-drop workflow. Place it beside the slide’s main message, crop it from an edge, or use it as a low-contrast background. Keep titles and key numbers in clear, unobstructed space.
Build a hierarchy around the map
The map should not be the first thing the audience reads unless the slide is explicitly about geography. Use a restrained color for a supporting treatment, or give a higher-contrast map its own half of the slide. Limit surrounding graphics so the composition stays easy to scan.
Keep a fallback image
If a presentation will move across several tools or be shared as a universal file, keep a high-resolution PNG version of the same map. PNG is helpful for fixed slide outputs, while SVG remains useful as a scalable master asset.
Test at presentation scale
View the slide in presentation mode. Check whether the dots remain clear, the map color works against the display background, and the type is still the main focus. Adjust dot density or scale if the map looks too fine from a distance.
Final thoughts
World map SVGs can make Keynote slides feel more polished and adaptable. Create a map for the specific slide, protect the presentation hierarchy, and keep both vector and raster versions available when sharing requires flexibility.