What is World Dotted Maps
In an age dominated by high-resolution satellite imagery and ultra-detailed geographic information systems (GIS), it may seem counterintuitive that abstract, minimalist representations of the world are gaining popularity. Yet, world dotted maps—also known as dot maps or dotted world maps—are captivating artists, educators, designers, and data visualizers alike.
But what exactly are world dotted maps? Why are they suddenly trending across design platforms, educational resources, and data dashboards? And how can you create one yourself? In this article, we’ll explore the fascinating world of dotted maps, their history, applications, and how tools like World in Dots make it easier than ever to generate your own custom creations.
Understanding the Basics: What is a World Dotted Map?
A world dotted map is a stylized visual representation of geographic regions, where dots are used instead of continuous shapes, colors, or lines to depict locations, borders, or statistical data. These dots are arranged in grid-like or organic patterns to give a simplified—but often striking—visual of the earth’s continents, countries, or regions.
Unlike traditional maps that focus on precision and geographic fidelity, world dotted maps favor abstraction, aesthetics, and thematic clarity. The goal is not necessarily to show every mountain or coastline but to evoke the idea of the world in a visually elegant and sometimes data-rich way.
A Brief History of Dot Mapping
Dot mapping is not new. In fact, it dates back to the early days of cartography and statistics. One of the earliest known uses was by French geographer Charles Dupin in the 1830s, who used dots to show literacy rates across France. Later, Dr. John Snow famously used dot mapping in 1854 to trace the origins of a cholera outbreak in London.
These early examples focused more on statistical dot maps—where each dot represents a number of events or people. Modern world map dots, however, have evolved to incorporate both data and design, bridging the gap between information and aesthetics.
Why World Dotted Maps Are Popular Today
There’s been a noticeable surge in interest around dotted maps, particularly on social media, print design, and web interfaces. Here's why:
1. Minimalist Aesthetics
Dot maps offer a clean and modern design language. With just a few geometric elements, they can communicate a lot of information or simply serve as elegant decor.
2. Flexibility
Dots can represent almost anything: population, rainfall, language distribution, or simply the outline of a country. This flexibility makes them appealing for both designers and data scientists.
3. Visual Engagement
Our brains are wired to find patterns. When we see a map composed entirely of dots, we instinctively fill in the gaps. This visual inference creates a sense of engagement.
4. Scalability
Dotted maps look great at different scales. Whether you’re showing the entire world or zooming into a single country, you can maintain a consistent visual style.
5. Interactivity
In web applications, dots can be interactive, providing tooltips or pop-ups with more information. This makes them ideal for data-driven dashboards or educational tools.
Types of World Dotted Maps
While the general concept remains the same, world dotted maps can be classified based on purpose and design approach:
-
Geographic Dot Maps: These maps place dots based on real geographic coordinates. For example, each dot could represent 100,000 people, and their position would align with actual population centers.
-
Pattern-Based Dotted Maps: Here, dots are arranged in a uniform grid to approximate the shape of countries or continents. These are often used for artistic or illustrative purposes.
-
Pixel Maps: Pixel-style dotted maps use fixed-size dots aligned to a grid, mimicking pixel art. These are particularly popular in digital design and gaming-inspired visuals.
-
Abstract Dotscapes: These are more artistic representations where dots are scattered or clustered in non-literal ways, evoking a sense of geography without strict alignment.
Practical Uses of World Map Dots
The simplicity and flexibility of dot-based maps make them useful across a wide range of fields:
-
Design and Branding: Startups and companies often use stylized world dot maps on landing pages to showcase global reach, user bases, or product expansion.
-
Education: Teachers and educators use dot maps to simplify geography for students or illustrate complex topics like migration or climate zones.
-
Data Visualization: Dots can be animated or color-coded to represent different variables—ideal for showcasing large datasets without overwhelming the viewer.
-
Decor and Art: From wall posters to digital wallpaper, dot maps are increasingly being used as minimalist art pieces.
Creating Your Own World Dotted Map with World in Dots
This is where platforms like World in Dots come in. Designed for ease of use and creative flexibility, World in Dots allows users to generate custom dotted maps of the world, continents, or specific countries.
Features of World in Dots:
- High-resolution SVG Export: Perfect for print and responsive web usage.
- Custom Dot Size & Spacing: Adjust density to match your style.
- Region Selection: Choose a specific country, continent, or the entire globe.
- Color Customization: Match your brand colors or project palette.
- Lightweight Output: Ideal for fast-loading web pages.
Whether you're a designer looking to create a modern backdrop or a teacher preparing classroom materials, World in Dots provides a powerful yet accessible way to bring dotted maps to life.
Visual Example: A Classic World Dotted Map
Below is an example of a minimalist world dotted map—a stylized representation of the globe using uniform dots to indicate land masses.
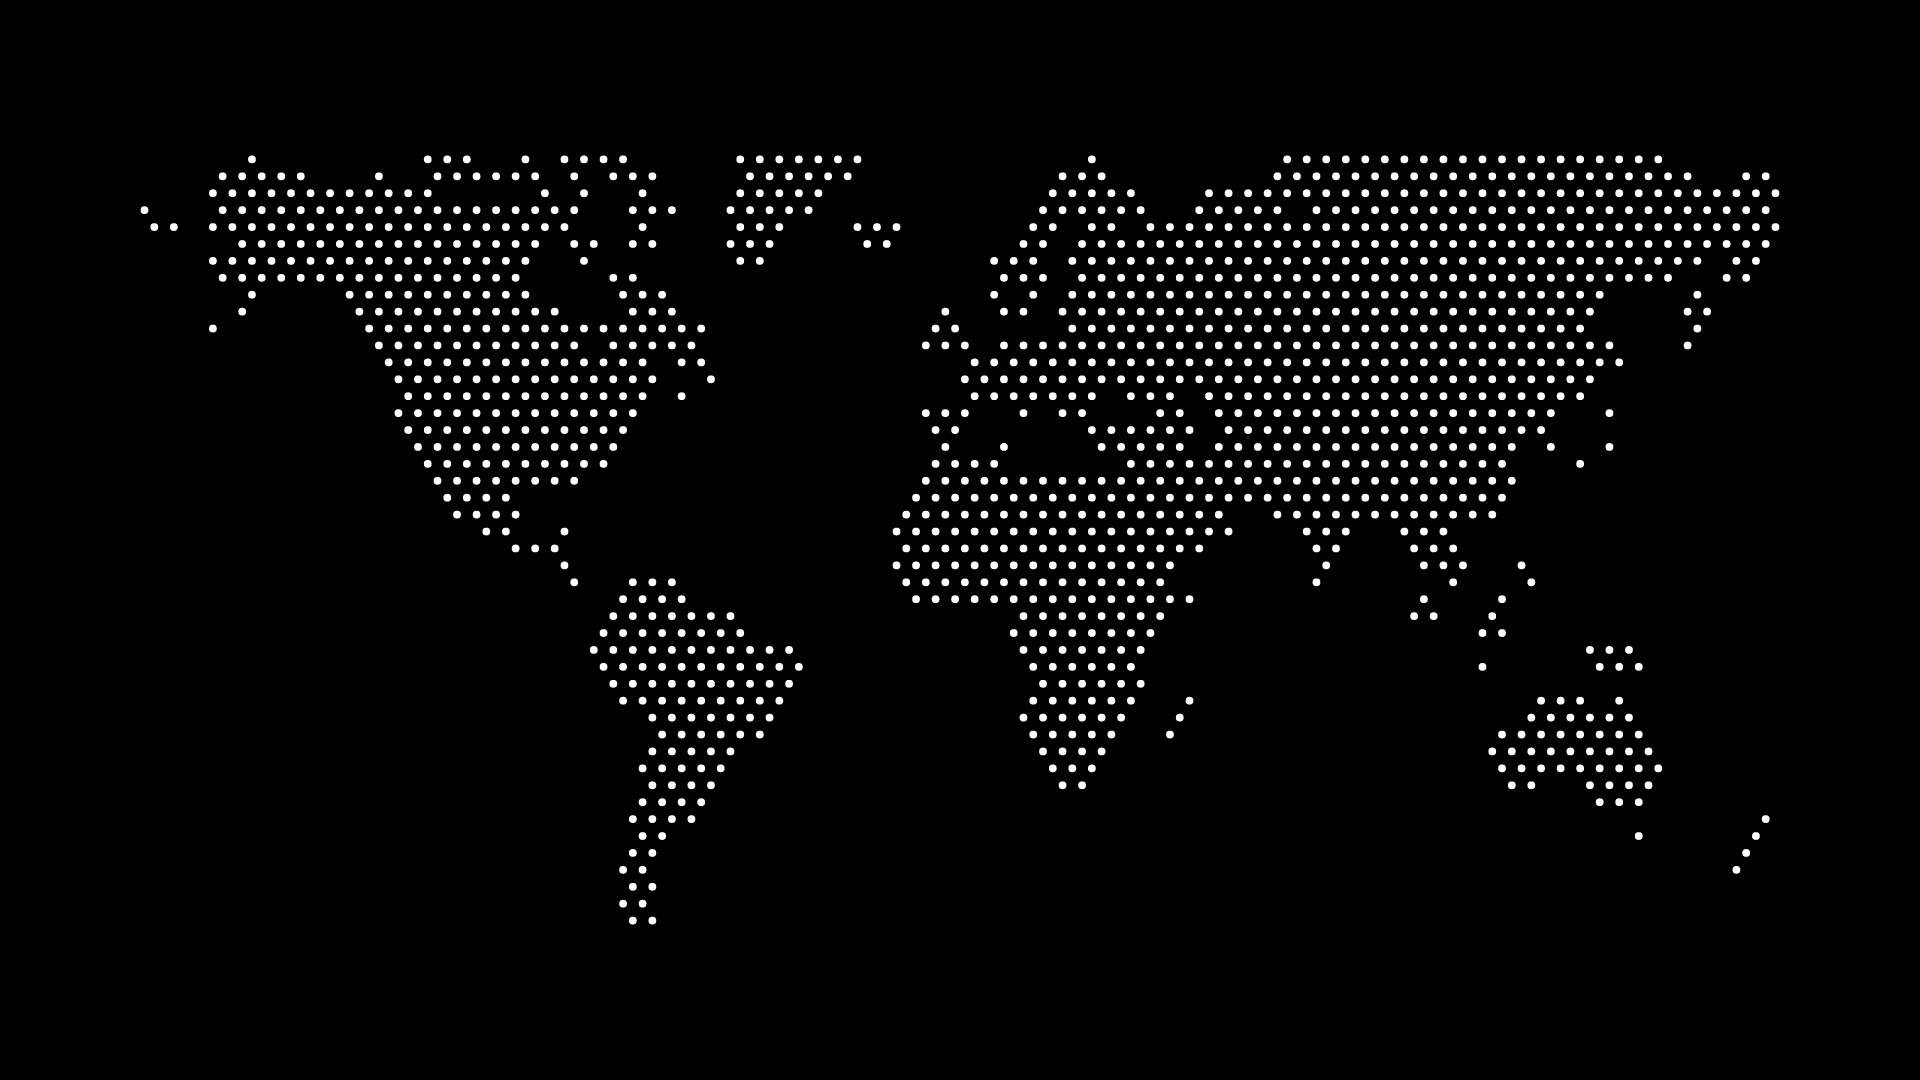
This image showcases the global continents formed entirely with evenly spaced dots, demonstrating the clarity and visual rhythm dotted maps can provide.
This form of mapping is ideal for:
- Hero sections of landing pages
- Educational infographics
- Print poster designs
- Background elements in presentations
Final Thoughts
World dotted maps are much more than a design trend—they’re a testament to how simplicity, abstraction, and data can merge to form meaningful visual narratives. Whether you're a data analyst, an educator, a designer, or someone who just loves maps, world map dots open up a world of creative and communicative possibilities.
And with platforms like World in Dots, anyone can now generate stunning, shareable, and customizable dotted maps in just a few clicks.
Ready to explore the world, one dot at a time?