Adding a Dotted World Map to Coda Docs
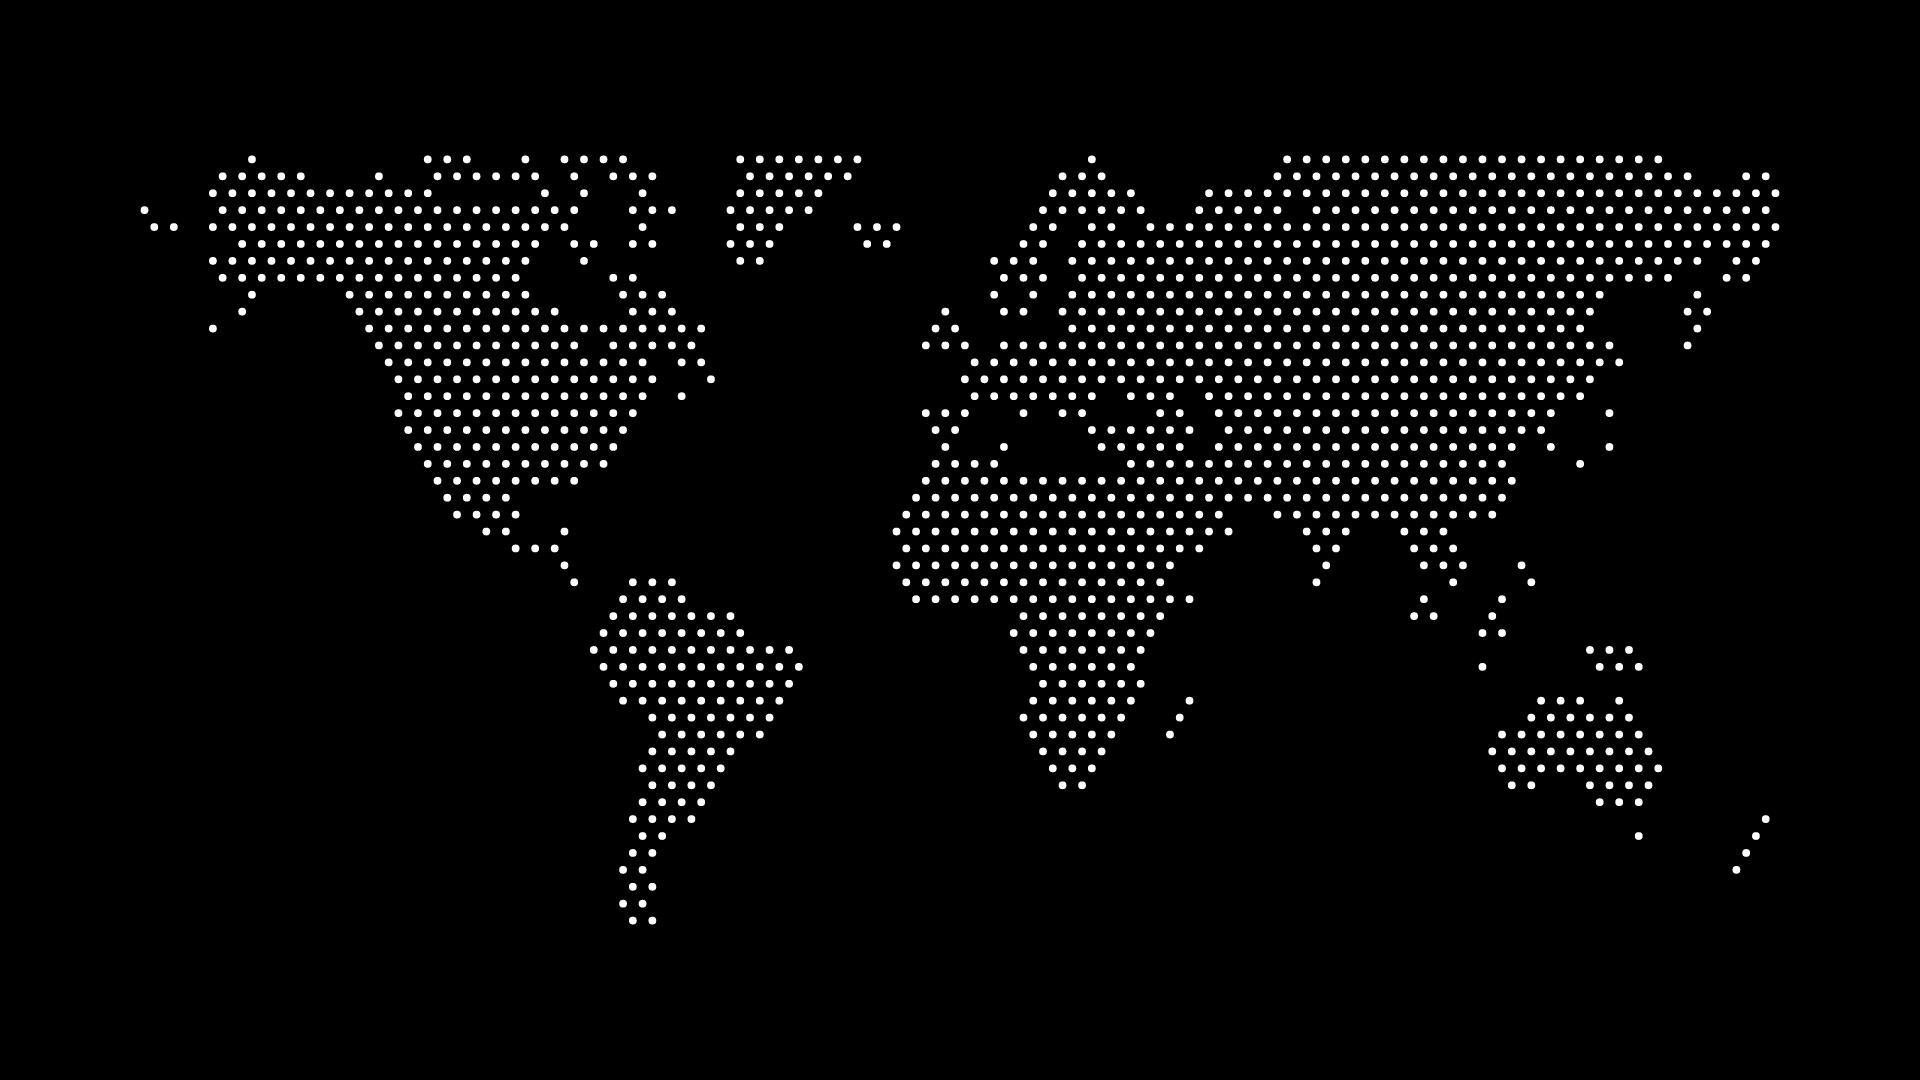
Coda docs are good at turning a spreadsheet into an app, but they're not good at turning a column of country names into something you can read at a glance. Adding a dotted world map to a Coda doc fixes that gap: instead of scrolling a "Country" column to guess how spread out your customers or team actually are, you get one image that answers the question instantly.
Coda has geography-flavored packs, but most of them either need an API key and usage limits, or render an interactive map that's overkill for a doc meant to be read quickly by a teammate or exec. A static exported map sidesteps both problems — no setup, no rate limits, and it renders identically for every viewer regardless of their Coda plan.
Where the Map Fits in a Doc
A few placements work well depending on what the doc is for:
- A canvas image block at the top of an overview page — pairs naturally with summary numbers in a table right below it.
- Inside a page tied to a specific view — if you've filtered a table to "Active Customers" or "Q3 Hires," drop the matching map right next to that filtered view.
- A pinned reference page — some teams keep one "Company Snapshot" page with a map, headcount, and revenue numbers that gets linked from other docs rather than rebuilt everywhere.
None of these require a Coda pack, a formula, or edit access beyond adding an image — which matters if the person updating the doc isn't the person who built it.
Building a Map That Matches Your Table
Start from a dotted world map and select only the countries your table actually contains — pull the unique values from your "Country" column rather than estimating, since Coda docs get shared widely and an inaccurate map undermines the table it's supposed to summarize. Export as PNG; Coda's canvas blocks handle raster images more predictably than inline SVG across desktop and the mobile app, and a PNG also survives being copied between docs without losing formatting.
Keep the export close to the width of your table or page column — a canvas image scales down cleanly but rarely needs to be wider than around 1000–1200px for a doc that's mostly read on a laptop screen. If the doc has a light background, a neutral dot color with one accent for highlighted countries stays legible without pulling focus from the numbers around it.
Keeping It Synced With the Table
A Coda table changes constantly; a pasted image does not. Rather than trying to automate this with a pack, the more reliable pattern is tying the refresh to something that already happens on a schedule:
- Attach it to a recurring review — if the doc already gets opened for a weekly or monthly update, re-export the map as part of that ritual rather than as a separate task nobody remembers.
- Trigger off a milestone, not a calendar — regenerate when the underlying data changes meaningfully (a new market opens, a new region gets covered) instead of on a fixed interval.
- Use a Coda button as a reminder, not a generator — a button row can prompt "map needs updating" based on a formula comparing row counts, even though it can't produce the image itself.
A Practical Use for Sales and Ops Docs
If you're running a sales pipeline in a Coda table with a "Country" or "Region" column, filter to closed-won deals, copy the distinct values into World in Dots, and export. This pairs well with creating revenue by region graphics for reports if the same doc also needs to show where revenue is concentrated rather than just where customers exist — a presence map and a revenue-weighted map tell different stories from the same underlying table.
For ops-focused docs tracking hiring locations or vendor coverage, the same export process applies. How startups use map graphics to show global reach has useful framing on what to emphasize once the map exists, since "everywhere we have a customer" and "everywhere we have a person on the ground" call for different visual treatment even when the underlying country list overlaps.
Final Thoughts
A dotted world map won't replace Coda's tables, formulas, or views, but it gives a doc something none of those provide on their own: an image a reader absorbs in half a second instead of a column they have to scroll. Since the whole workflow is generate, export, drop into a canvas block, it's a fast upgrade to any Coda doc that already tracks geography in a table.