How to Simplify GeoJSON Files for Faster Maps
If a map is loading slowly or a GeoJSON file is far larger than it has any right to be, the fix is usually to simplify GeoJSON by reducing the number of vertices in each polygon. A high-resolution coastline dataset can encode a country's border with tens of thousands of points — accurate down to individual bays and headlands, and almost always far more detail than a screen can actually display.
Where all those vertices come from
Public geographic datasets are often built for cartographic or scientific accuracy, not for web performance. A country boundary sourced from satellite imagery or a national mapping agency can trace every curve of a coastline at a resolution meant for print or GIS analysis. Rendered at the size of a section on a web page, most of that detail is invisible — two points half a pixel apart contribute nothing to how the shape looks, but each one still adds bytes to the file and work for the renderer.
The gap between "geographically precise" and "visually necessary" is exactly what simplification closes.
How the Douglas-Peucker algorithm works
The most common simplification method, Douglas-Peucker, works on one principle: keep points that meaningfully change the shape of a line, and drop points that lie close to a straight line between their neighbors.
In practice:
- Start with the two endpoints of a line segment.
- Find the point farthest from the straight line connecting them.
- If that farthest point is within a set tolerance, discard every point between the endpoints — a straight line is a good enough approximation.
- If it's outside the tolerance, keep that point and repeat the process recursively on the two halves.
The tolerance value is the only real decision to make. A small tolerance keeps subtle curves intact but saves less space; a large tolerance produces a smaller, blockier file. The right value depends entirely on the map's final display size — a country rendered at 200 pixels wide can tolerate far more simplification than one filling a 4K print.
What to check before and after
Simplifying isn't a settings change you apply blindly. A few things worth verifying:
- Small islands and narrow peninsulas can disappear at aggressive tolerance levels, since the algorithm has no concept of "this feature is important" — it only measures distance from a line.
- Shared borders between adjacent countries can drift apart if each country's boundary is simplified independently, leaving a visible gap or overlap where there used to be a shared edge. This mostly matters for multi-country datasets rendered together.
- File size and vertex count are the metrics that matter, not visual inspection alone — a shape can look identical at a glance while still carrying thousands of unnecessary points if the tolerance was set too conservatively.
A good workflow is iterative: simplify, preview at the actual display size, and increase tolerance until the shape just starts to visibly change, then back off slightly.
Why this matters for web maps specifically
Vertex count feeds directly into two things that affect page performance:
- File size. Every point in a polygon is several characters in the underlying JSON. A coastline with 50,000 points can easily add hundreds of kilobytes to a page's payload — see Optimizing SVG Maps for Web Performance for how this compounds once the geometry is converted to a rendered format.
- Rendering time. Whether the geometry is drawn on a
<canvas>, projected into SVG, or handed to a mapping library, more points mean more work per frame, which is especially noticeable when a map animates, zooms, or is one of several loaded on a single page — a case covered in Lazy Loading Maps for Faster Page Speed.
Simplifying before conversion, rather than after, also keeps downstream tooling simpler — a smaller GeoJSON file is faster to convert into SVG paths, as described in GeoJSON to SVG: How to Convert Map Data for Web Design, and faster to compress once it's a finished asset, per How to Compress SVG Maps for Faster Loading.
A tool for the one-off case
Writing a Douglas-Peucker implementation is a reasonable weekend project, but most people just need to shrink one file without adding a dependency to a project. World in Dots' GeoJSON Simplifier runs the algorithm entirely in the browser — paste or upload a file, drag a tolerance slider, and watch the vertex count and file size drop in real time before copying or downloading the result.
When simplification isn't the answer
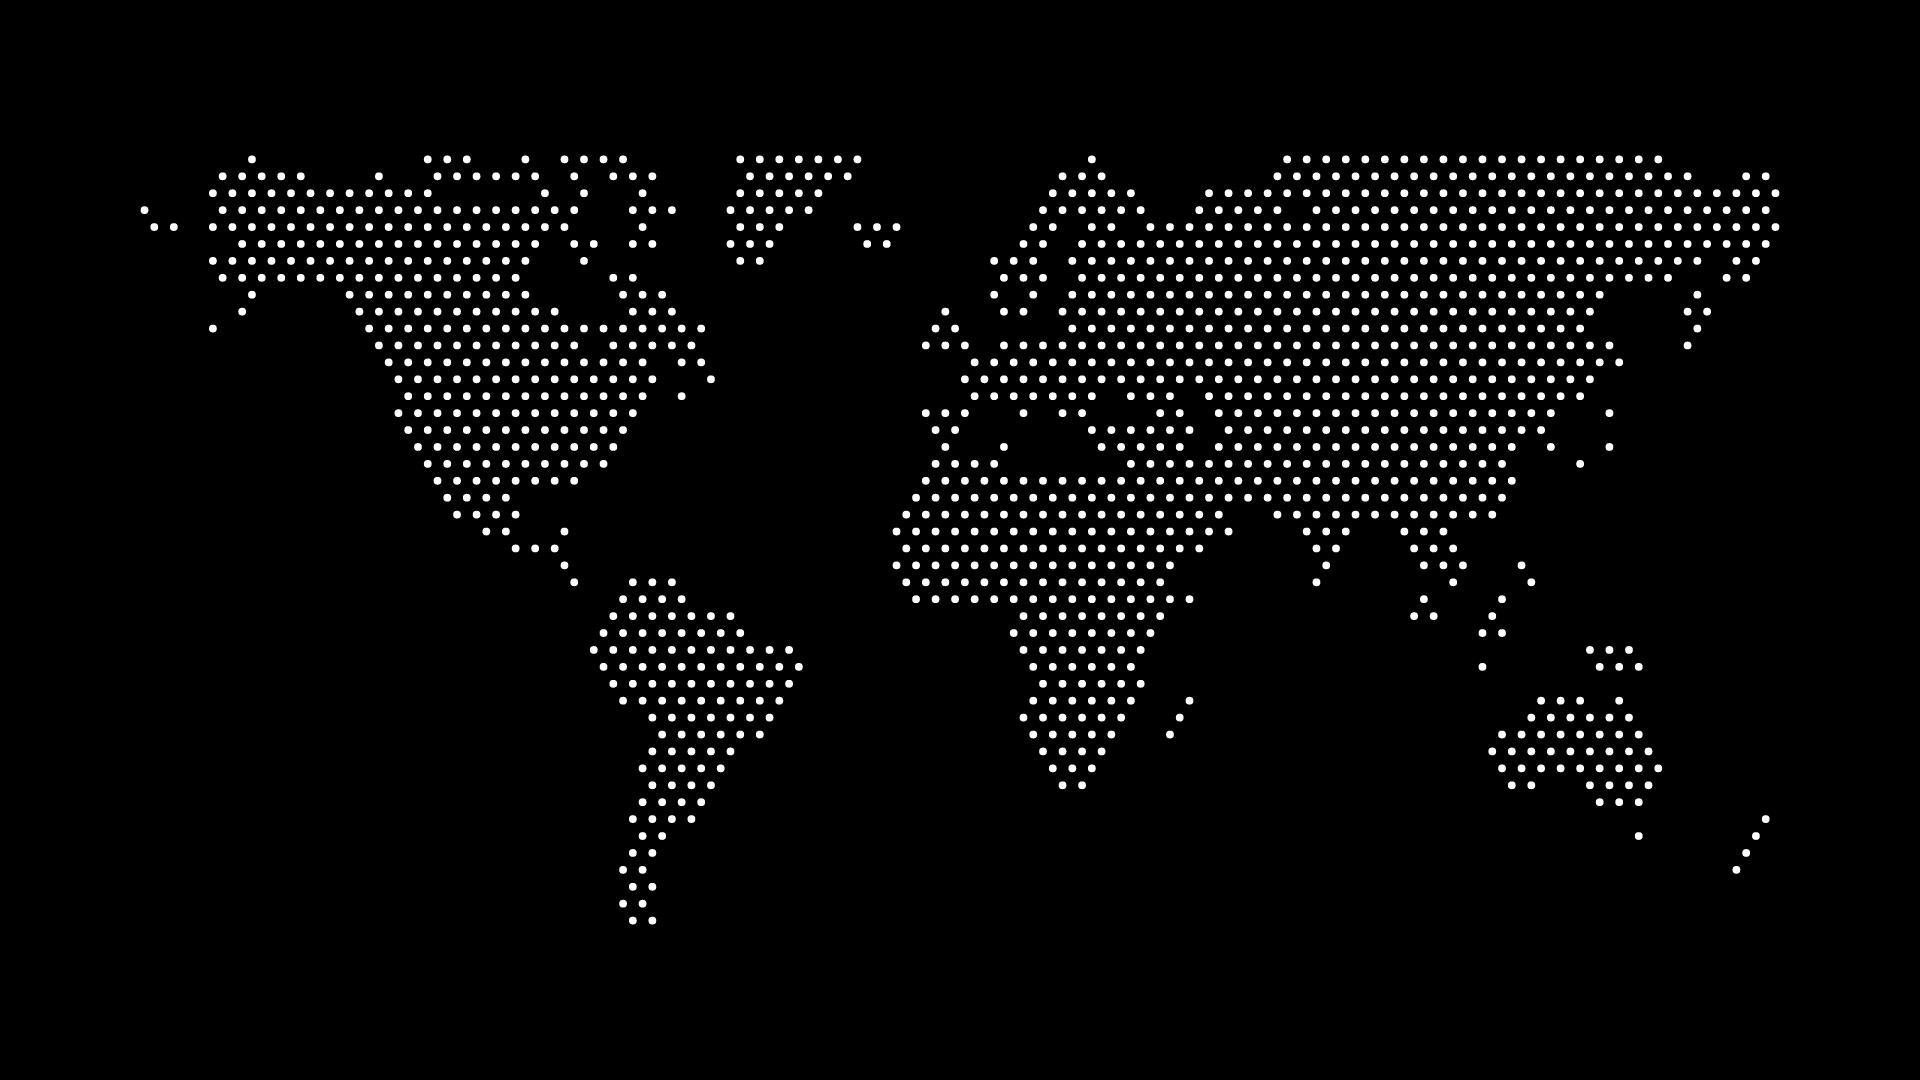
If the map is decorative rather than data-driven — a background graphic, a hero section, a slide — it may be worth skipping GeoJSON entirely rather than simplifying it. World in Dots generates a dotted vector map for any country or region directly as SVG or PNG, with no source geometry to manage, simplify, or convert.
Final thoughts
Simplifying GeoJSON is a trade between geographic precision and file weight, and for almost any web map, the extra precision in a raw dataset is invisible at render size. Douglas-Peucker with a sensibly chosen tolerance removes the vertices that aren't earning their place, cutting file size and render time without a viewer ever noticing the difference.