Making a Year in Review Map Graphic for Social Media
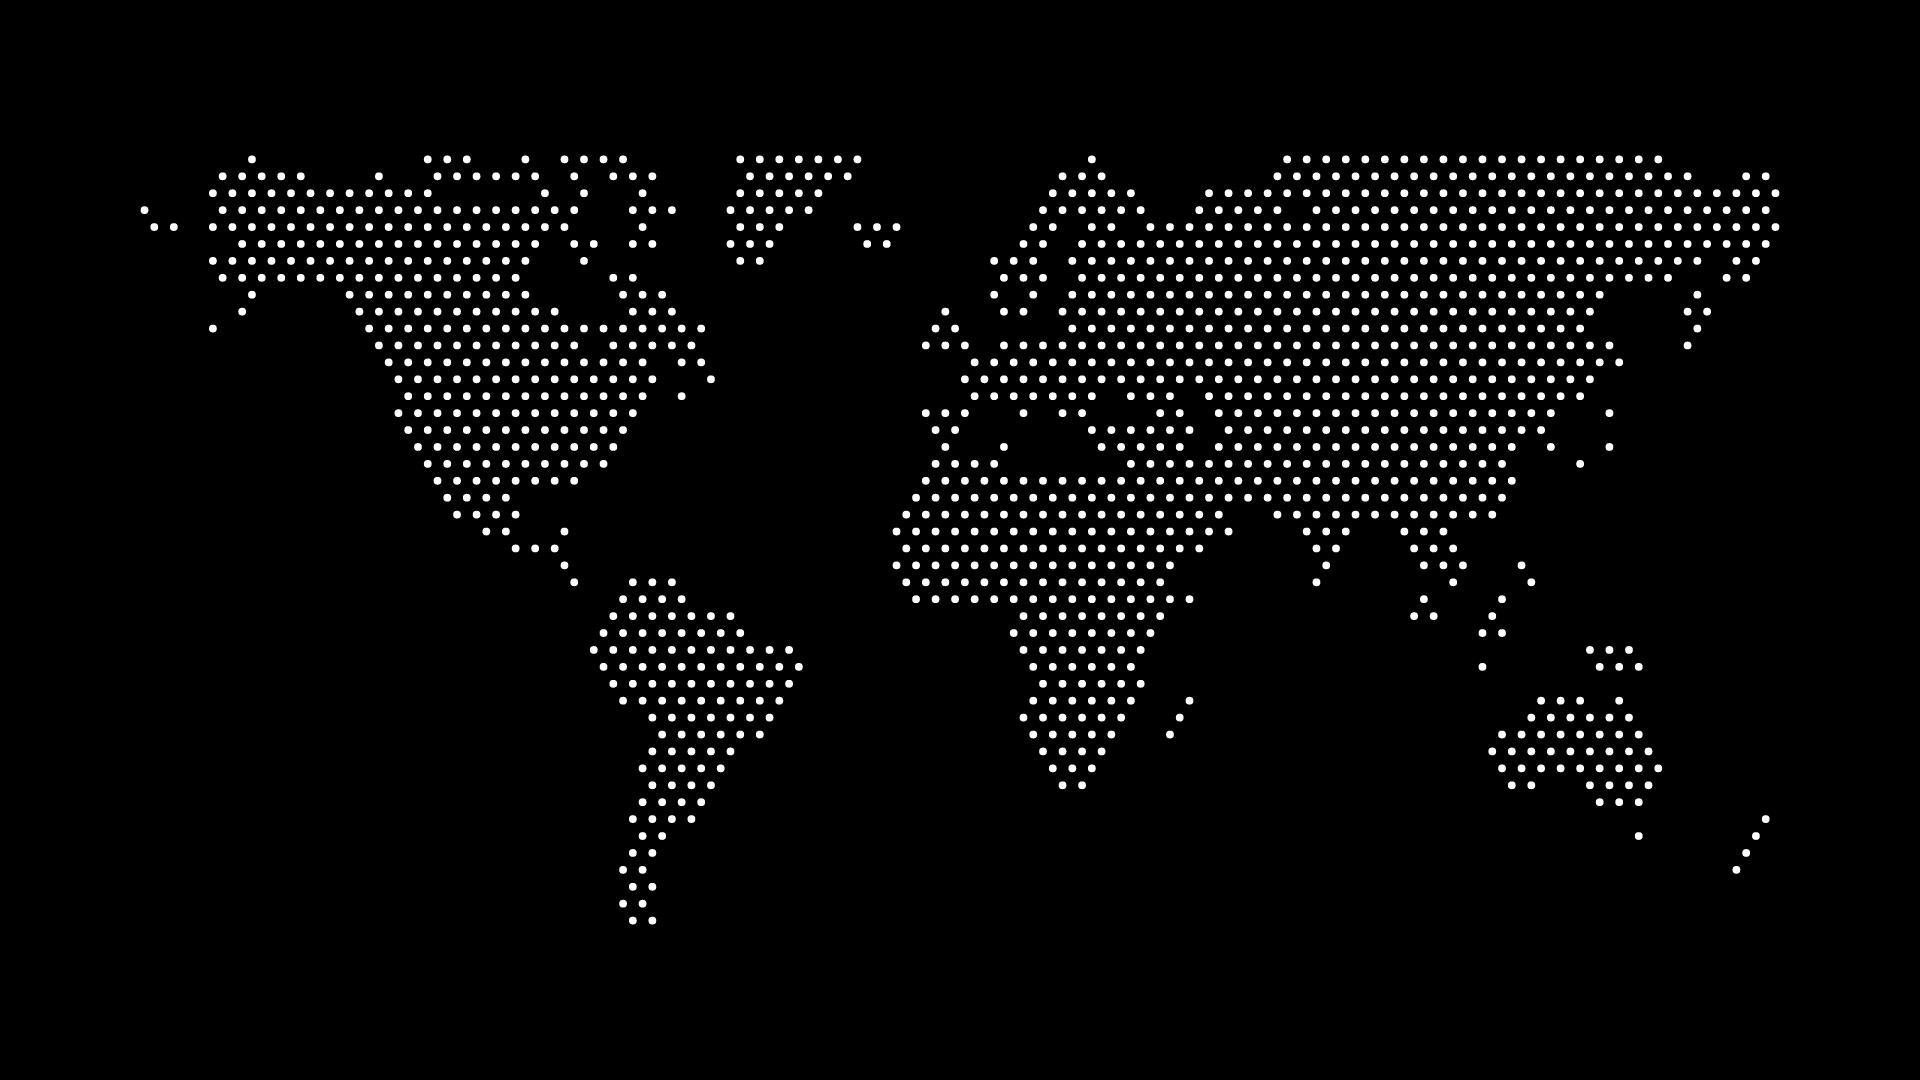
Every December, feeds fill with year-in-review posts, and the ones that stop people scrolling are almost never text lists — they're a single image that says "here's my year" at a glance. A year in review map graphic does that better than a photo grid or a stat card when the story you're telling is fundamentally geographic: places visited, markets entered, customers won, or a team that grew across time zones.
The format works because it compresses twelve months into one static image a viewer reads in under two seconds, which is exactly what a feed rewards. A map with a handful of highlighted countries and a short caption outperforms a dense infographic every time, because the whole point of the format is instant legibility, not depth.
Picking What the Map Actually Represents
Before touching any design settings, decide what the highlighted countries mean, since this is the single choice that determines whether the graphic reads as a real reflection or a vague brag:
- Personal travel — countries or cities actually visited, not aspirational ones.
- Business growth — new markets entered, new customers signed, or new team members hired, depending on what your year-end review is actually about.
- Community reach — for creators or newsletters, the countries your audience is concentrated in, pulled from real analytics rather than guessed.
Mixing categories on one map (some countries visited, others just admired from afar) undermines the format's honesty and, for business use, its credibility with anyone who can fact-check it.
Designing for the Feed, Not the Wall
A year-in-review graphic behaves differently than a printed map: it's viewed small, often for a second or two, frequently on a phone. That changes a few defaults from how you'd design a dotted world map for print:
- Fewer, bolder highlights — three to eight standout countries read clearly; twenty subtle ones blur together at thumbnail size.
- A square or 4:5 crop — matches how most platforms display feed posts before a viewer taps to expand.
- One accent color for the highlighted countries against a muted base map, rather than a full palette competing with your caption text.
Export as PNG at a size matched to your platform's recommended dimensions — Instagram and LinkedIn both compress images on upload, so starting oversized avoids a soft, blurry result after their processing.
A Simple Build Process
Start from a dotted world map, select this year's real list of countries, and apply your accent color only to that set — everything else stays in the neutral base tone. If your year included a lot of travel specifically, this pairs directly with the workflow in creating countries visited maps for travel blogs, which covers keeping the country list accurate as it grows through the year rather than reconstructing it from memory in December.
For a business-facing version, creating location-based graphics for social media covers caption and posting-format choices that carry over directly once the map itself is built, and how travel bloggers use custom maps to engage readers is worth reading if the post is meant to invite comments and replies rather than just get a quick like.
Pairing the Map With a Caption That Adds Numbers
The map answers "where," but a good year-in-review caption adds the "how much" a static image can't carry on its own — total countries, a standout single trip or deal, or a comparison to last year's map. Keep the caption short enough that it doesn't compete with the image for attention; the map should do the work of stopping the scroll, and the caption should do the work of holding it for one more sentence.
Final Thoughts
A year-in-review map works because it turns twelve months of scattered activity into one honest, instantly readable image — no infographic software, no dense stat block, just a base map and a handful of accurately highlighted countries. Build the list from real data, keep the highlight color to one, and export at your platform's native size so it doesn't lose sharpness the moment it hits the feed.