World in Dots vs Datawrapper: Choosing the Right Map Tool
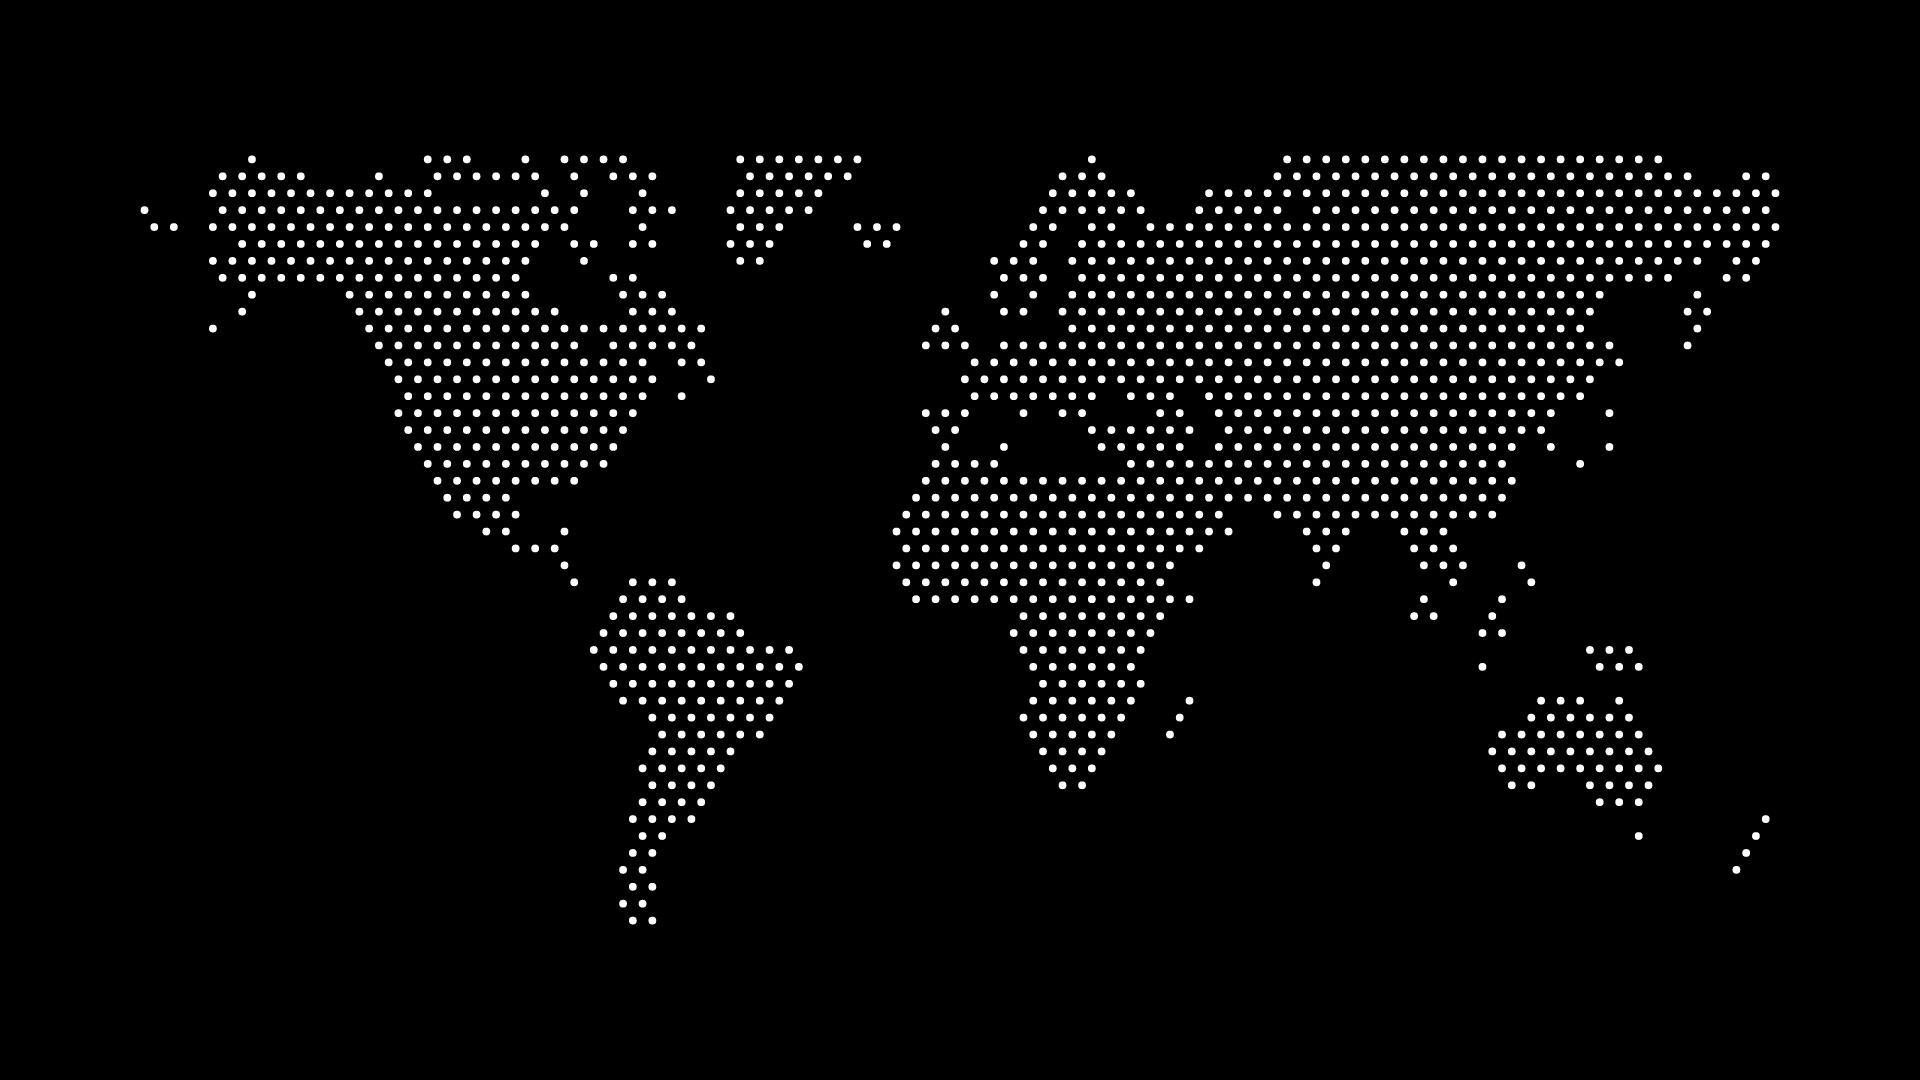
World in Dots vs. Datawrapper is really a comparison between two different jobs that both happen to produce map graphics. Datawrapper is a data visualization tool built for journalists and analysts — you upload a dataset, and it renders that data onto a map as shaded regions, sized symbols, or spikes. World in Dots doesn't take a dataset at all; it generates a decorative dotted-pattern map from a country, region, or set of colors you choose directly. If your map needs to represent numbers, they solve different problems.
What Each Tool Actually Does
Datawrapper connects data to geography. You upload a spreadsheet with values per country, region, or custom-uploaded area, and it builds a choropleth map (regions shaded by value), a symbol map (markers sized or colored by value), or a locator map (points on a base map). It's built around a large library of base maps — Datawrapper documents thousands of available basemaps and cartograms — with export to PNG, PDF, and SVG (vector PDF export for its more complex locator maps requires a paid Custom or Enterprise plan).
World in Dots doesn't take a dataset as input. You pick a country, region, or US state, set a dot color, density, and background, and it generates a fresh dotted-pattern SVG or PNG on the spot. There's no data upload step because the output isn't representing values — it's a stylized illustration of the geography itself, meant to be dropped into a design rather than read as a chart.
Where Datawrapper Has the Edge
- Actual data visualization. If your map needs to show a real dataset — population by country, election results by region, survey responses by state — Datawrapper is built for exactly that, with legends, tooltips, and value-based color scales handled for you.
- A large basemap library. With thousands of basemaps and cartograms available, Datawrapper covers far more geographic granularity than country, region, and US-state outlines.
- Interactivity. Datawrapper's maps are interactive by default on the web — hoverable tooltips, clickable regions — which a static SVG doesn't offer without additional custom work.
- Journalism-oriented publishing tools. Datawrapper is widely used in newsrooms specifically because it's built to publish quickly with editorial-grade defaults, annotations, and responsive embeds.
Where World in Dots Has the Edge
- No dataset required. If you just need a clean map graphic — a hero image, a slide background, a header illustration — Datawrapper's data-upload workflow is unnecessary overhead. World in Dots skips straight to the visual result.
- A distinct decorative style. The stippled, dotted aesthetic is a specific design choice, not a data-encoding one — useful for brand and marketing material where a filled or shaded region map would look too much like a chart rather than an illustration.
- A dedicated page per country, region, and US state, so landing on the exact geography you need doesn't require configuring a base map first.
- A flat, predictable cost for unlimited exports, rather than a tool whose more advanced export options are gated behind paid tiers.
A Practical Way to Decide
| If you need... | Consider |
|---|---|
| A map that visualizes real data (values by country, region, or state) | Datawrapper |
| A decorative, brand-matched map for a slide, hero image, or report cover | World in Dots |
| An interactive, hoverable map for a web article | Datawrapper |
| A quick SVG you can drop into a design tool and recolor freely | World in Dots |
| Publishing tools built for newsroom-grade data journalism | Datawrapper |
For a comparison against a tool closer to World in Dots' own category — a coloring-based map generator rather than a data-visualization platform — see World in Dots vs. Mapchart. And for the stock-asset alternative to generating a map at all, World in Dots vs. Freepik covers that comparison.
The Bottom Line
Datawrapper is the right choice when your map needs to represent actual data and you want interactivity and publishing tools built around that. World in Dots is the right choice when you know the geography you need and want a clean, decorative dotted SVG without a data-upload step in the way — a distinction closer to "chart" versus "illustration" than a head-to-head feature comparison.
Generate Your Own Map
Skip the data-upload step entirely and build the exact decorative map you need in the map generator — pick your region, set your colors, and export a ready-to-use SVG or PNG. For a broader look at how other tools in this space compare, see free SVG map tools compared.