World in Dots vs Mapchart: Choosing the Right Map Tool
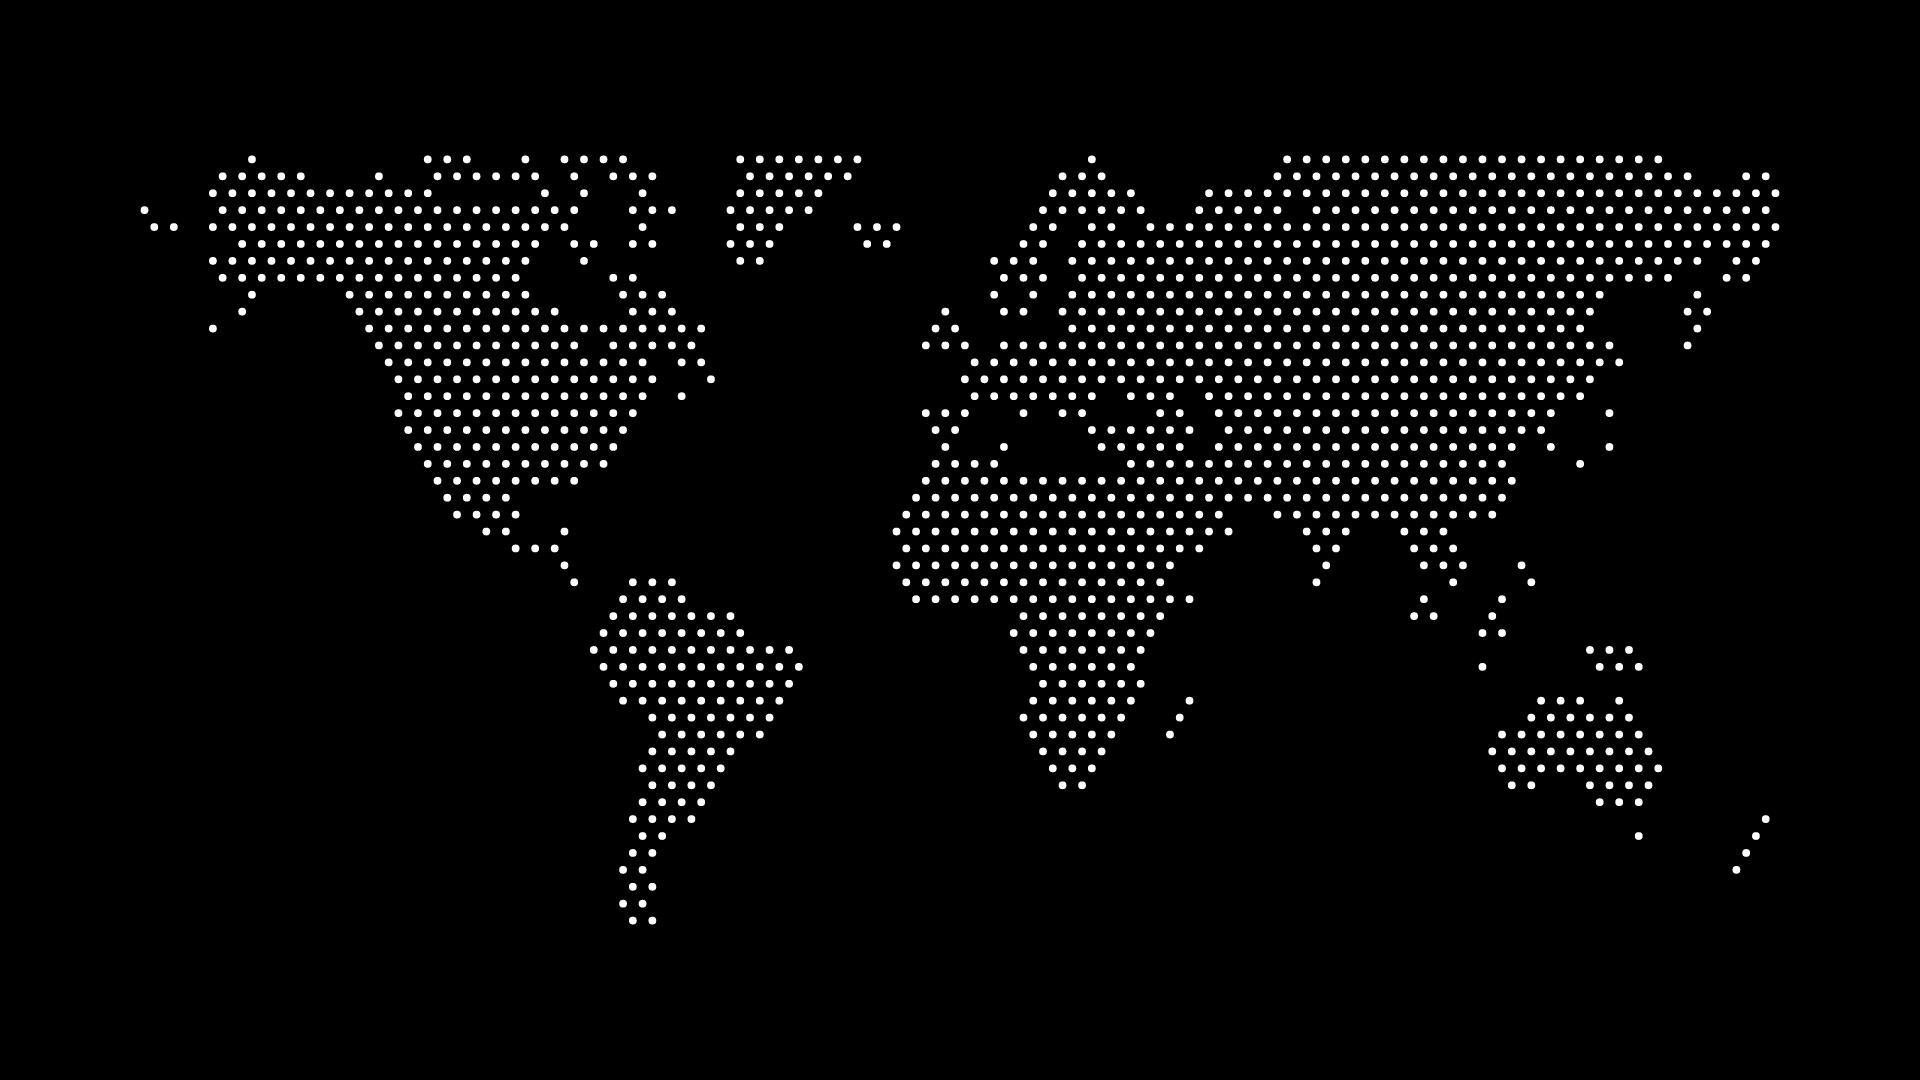
World in Dots vs Mapchart is a comparison that comes up because both are free, browser-based map tools, but they're built for genuinely different jobs. Mapchart is designed for coloring in regions of a map — countries you've visited, election results, region-by-region comparisons — while World in Dots generates a stippled, dotted-style vector map meant as a design asset for websites, decks, and print.
Picking the right one up front saves a redo later, so here's how the two actually differ.
What Mapchart is built for
Mapchart.net lets you click individual countries, states, or regions on a map and assign each one a color, then export the result as an image. It's a strong fit when the point of the map is to communicate which regions fall into which category:
- A "countries I've visited" map with visited countries shaded in.
- A results map where each region is colored by an outcome or category.
- A quiz or presentation graphic where regions need distinct, assignable colors.
The output is a filled, choropleth-style map — solid regions of color with clear borders — and that's exactly the right visual language when the message is about categorizing regions, not about texture or aesthetic.
What World in Dots is built for
World in Dots generates a dotted, stippled map — the world, a continent, a country, or a US state — as a downloadable SVG or PNG, with control over dot size, density, and color. It's built for a different job: a distinctive, minimalist visual asset that works as a background, a hero graphic, a slide element, or a printed piece, rather than a way to categorize regions by color.
That distinction shows up in a few practical differences:
| Mapchart | World in Dots | |
|---|---|---|
| Core output | Filled, colored regions | Dotted, stippled pattern |
| Best for | Categorizing regions (visited, results, comparisons) | Decorative or brand visuals, backgrounds, decks |
| Region-level coloring | Yes, per-region | No — single style across the map |
| Vector export | Limited | SVG and PNG |
| Typical use | Data/quiz-style graphic | Design asset for web, print, and presentations |
When each one is the better fit
Choose Mapchart when the map's entire purpose is showing which regions belong to which group — a visited-countries map, an election or survey result, a side-by-side regional comparison. The filled-region style is what makes that categorization legible.
Choose World in Dots when you want a map as a piece of visual design rather than a data-categorization tool — a hero background for a global company's homepage, a minimalist map for a slide deck, wall art, or a brand asset that needs to match a specific color palette. The dotted texture reads as an aesthetic choice first and a geographic reference second, which is exactly what a filled choropleth map isn't trying to do.
Some projects genuinely want both: a filled Mapchart-style graphic for a specific data point in a report, and a dotted background map for the rest of the deck's visual identity. There's no rule against using either tool for the part of the job it's actually suited to.
If you're deciding between styles generally
The choice between a dotted style and a filled/choropleth style isn't unique to comparing these two tools — it's a broader design decision covered in Dotted Maps vs Choropleth Maps: Which Should You Use. If you know you want the dotted look but are still weighing free tool options generally, Free SVG Map Tools Compared: Finding the Right Fit and Best Free Tools for World Map Vector Downloads round out the comparison beyond just these two.
Final thoughts
Mapchart and World in Dots solve different problems that happen to both start from "I need a map." If the job is showing which regions fall into which category, Mapchart's filled, colorable regions are the right tool. If the job is a distinctive, minimalist visual for a brand, deck, or web page, a dotted map is the better starting point.
Generate a dotted map for your project at World in Dots and export it as SVG or PNG.